The seemingly innocuous question of the least common birthday often sparks curiosity. While most people might assume a random distribution of births throughout the year, statistical analysis reveals distinct patterns, influenced by a confluence of societal, biological, and even technological factors. Understanding these patterns can offer fascinating insights into human behavior and the subtle ways our lives are shaped by larger trends. This exploration delves into the digital footprints and data-driven realities that help us identify not only the least common birthday but also the underlying reasons for its rarity.
The Data Deluge: Unearthing Birthdate Distributions
The quest to identify the least common birthday begins with a massive undertaking: collecting and analyzing birth data. In an increasingly digitized world, this data is more accessible than ever before, though privacy concerns and data aggregation methods play a significant role in how it’s presented and understood.
Historical Data Collection and Public Datasets
Historically, understanding birthdate distributions relied on national vital statistics offices and census data. These organizations meticulously record births, providing foundational datasets. However, accessing and analyzing this raw data for public consumption can be challenging due to privacy regulations.
In the digital age, aggregators and researchers often piece together information from various sources. This can include anonymized data from healthcare providers, insurance companies, and even social media platforms that allow users to publicly share their birthdates. While the exact methodologies vary, the sheer volume of data now available allows for more granular insights than ever before.
Algorithmic Analysis and Predictive Modeling
With vast datasets comes the need for sophisticated analytical tools. Machine learning algorithms and statistical modeling are now employed to identify trends, outliers, and correlations within birthdate data. These algorithms can sift through millions of records to pinpoint birthdays that appear less frequently than expected.
The process involves comparing the observed frequency of each birthday against a statistically expected frequency, often assuming a uniform distribution as a baseline. However, real-world factors consistently deviate from this ideal. Predictive modeling can also be used to forecast future birthdate trends based on historical patterns and societal influences, though the inherent randomness of individual births still introduces a significant degree of unpredictability.
Challenges in Data Accuracy and Representation
It’s crucial to acknowledge the limitations and potential biases within birthdate data. Data accuracy can be affected by reporting errors, cultural nuances in date recording (e.g., the use of lunar calendars in some regions), and the digital divide, where certain populations might be less represented in digital datasets.
Furthermore, the definition of a “birthday” can sometimes be complex. Leap years, for instance, introduce an anomaly, with February 29th being the rarest birthday by definition. However, when excluding this unique case, other birthdays emerge as statistically less common. The data also often reflects the demographics of the population being studied, meaning that the “least common birthday” in one country or region might differ from another.
The Unveiling: Identifying the Least Common Birthdays
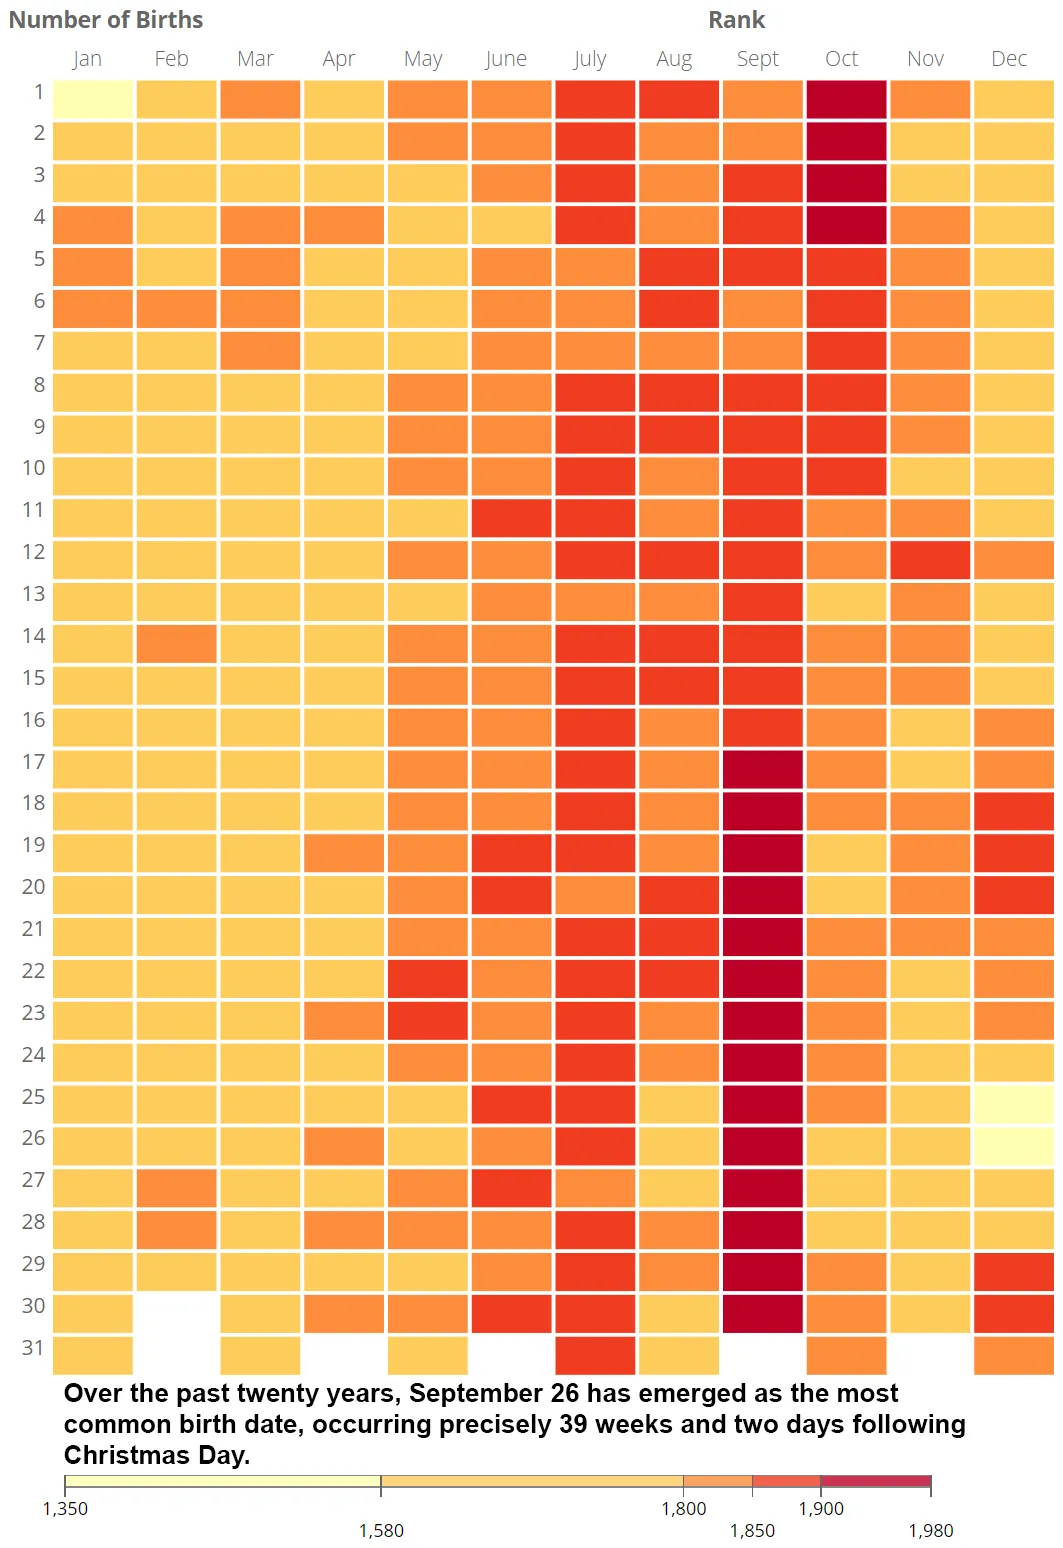
Through rigorous data analysis, several birthdays consistently emerge as the least common. These are not arbitrary dates but rather those influenced by a combination of factors that lead to a statistically lower number of births.
The Impact of Holidays and Celebrations
One of the most significant factors influencing birthdate distribution is the proximity to major holidays and celebratory periods. Anecdotal evidence and statistical studies strongly suggest that fewer babies are conceived and subsequently born around significant holidays, particularly Christmas and New Year’s.
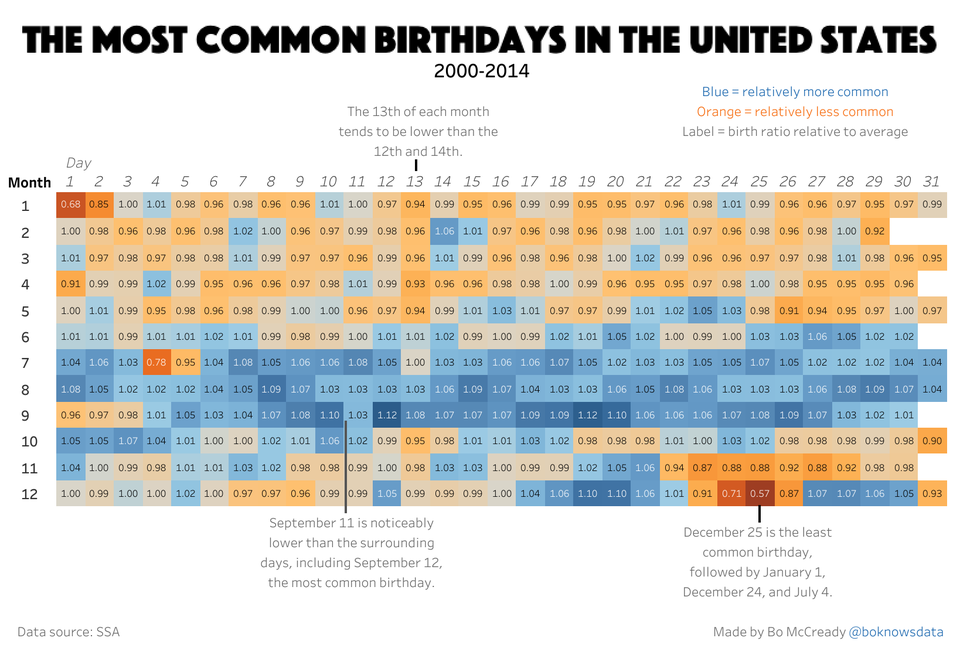
This phenomenon is often attributed to several reasons. Couples may intentionally try to avoid having a child born during the busy and often disruptive holiday season. Additionally, the festive atmosphere and potential for increased alcohol consumption during these periods might also play a minor role, although the primary driver is believed to be conscious planning. Consequently, the days immediately following these major holidays, such as December 26th and January 1st, tend to be among the least common birthdates.
The Influence of Labor Induction and Scheduled C-sections
Modern medical practices have a notable impact on birthdate distribution. The increasing trend of scheduled labor inductions and Cesarean sections (C-sections) allows for greater control over the timing of births. Healthcare providers and parents often opt for these procedures to occur on weekdays, avoiding weekends and holidays.
This leads to a clustering of births on weekdays, particularly Tuesdays, Wednesdays, and Thursdays. Conversely, Saturdays and Sundays often see a dip in birth rates due to fewer scheduled medical interventions. This deliberate manipulation of birth timing contributes to the rarity of certain weekend dates and dates immediately preceding or following public holidays.
The Anomaly of February 29th: Leap Year’s Rarity
While not a factor in identifying the least common birthday amongst the 365 days, it’s impossible to discuss birthdate rarity without mentioning February 29th. This date occurs only once every four years, making it inherently the rarest birthday by definition. Individuals born on this day, often referred to as “leaplings,” celebrate their birthdays on February 28th or March 1st in non-leap years. The unique occurrence of this date makes it an immediate outlier in any statistical analysis of birth frequency.
The Digital Footprint: How Technology Shapes Birthdate Data
Technology plays a dual role in understanding birthdate patterns: it provides the tools for analysis and also influences the data itself through its integration into our lives.
Big Data Analytics in Healthcare and Population Studies
The advent of electronic health records (EHRs) and advanced data analytics platforms has revolutionized how birth data is collected and analyzed. Hospitals and healthcare systems can now aggregate anonymized birth data, allowing for more precise identification of trends. This Big Data approach enables researchers to correlate birth patterns with socioeconomic factors, geographical locations, and even environmental influences.
These sophisticated analytical tools can identify subtle patterns that might have been missed by traditional statistical methods. By processing massive datasets, they can pinpoint birthdays that deviate significantly from the norm, contributing to a more nuanced understanding of birthdate distributions.
The Role of Social Media and Personal Data Sharing
While not a primary source for official birth statistics, social media platforms offer a unique, albeit less scientifically rigorous, perspective on birthdate trends. Users frequently share their birthdays on platforms like Facebook, LinkedIn, and Instagram. This user-generated content, when aggregated and analyzed (with appropriate privacy considerations), can provide supplementary insights into how birthdates are perceived and celebrated.
Furthermore, apps designed for baby-naming, pregnancy tracking, and even birth planning can collect data that, when anonymized, might offer clues about parental preferences and their influence on birth timing. This data, while often fragmented, contributes to the broader digital footprint of birthdate information.
Societal Rhythms: Beyond the Numbers
The least common birthdays are not merely statistical anomalies; they are reflections of deeper societal rhythms, cultural norms, and the evolving ways we plan and experience life events.
Cultural and Religious Influences on Conception and Birth
Beyond major Western holidays, cultural and religious calendars can also influence birth patterns. Periods of religious observance or festivals might see a dip in conception rates due to abstention or a focus on spiritual activities. Conversely, times of celebration or particular auspicious dates within certain cultural traditions might see a slight increase.
These cultural nuances, while often subtle, can contribute to the overall statistical distribution of birthdays, making certain dates less common due to ingrained societal practices and beliefs that influence family planning and the timing of significant life events.
The Modern Shift Towards Planned Parenthood and its Consequences
The increasing prevalence of planned parenthood and the ability to control reproductive timing through various medical interventions have undeniably reshaped birthdate distributions. The desire for convenient scheduling, avoiding inconvenient times, and ensuring the well-being of both mother and child during delivery all contribute to a less “random” distribution of birthdays.
As technology continues to advance, offering more precise control over birth timing, we may see further shifts in these patterns. The “least common birthday” is thus a dynamic entity, evolving alongside our societal structures and technological capabilities. It serves as a subtle reminder that even the most personal of life events are, to some extent, influenced by the larger, interconnected world around us.
aViewFromTheCave is a participant in the Amazon Services LLC Associates Program, an affiliate advertising program designed to provide a means for sites to earn advertising fees by advertising and linking to Amazon.com. Amazon, the Amazon logo, AmazonSupply, and the AmazonSupply logo are trademarks of Amazon.com, Inc. or its affiliates. As an Amazon Associate we earn affiliate commissions from qualifying purchases.