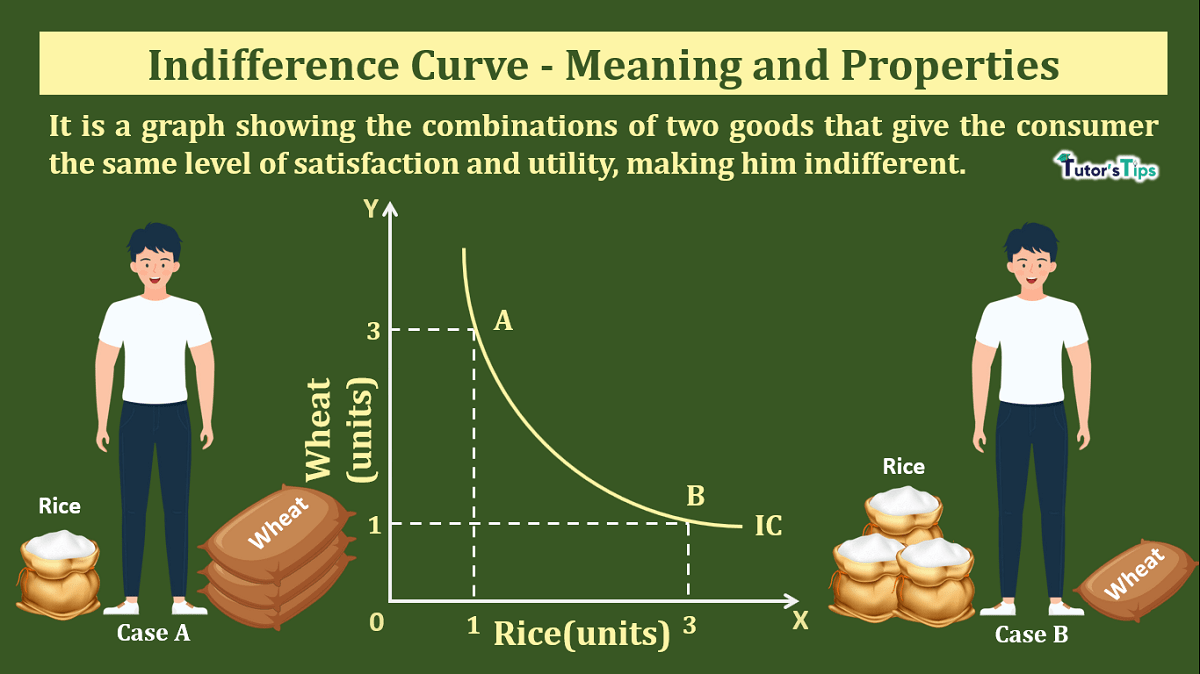
In the realm of economics, understanding consumer behavior is paramount. One of the foundational tools used to analyze this behavior is the indifference curve. This concept, rooted in microeconomics, helps us visualize and quantify how individuals make choices when faced with limited resources and a variety of goods and services. Essentially, an indifference curve represents all possible combinations of two goods that provide a consumer with the same level of satisfaction or utility. It’s a powerful abstraction that allows economists to build more complex models of consumer decision-making, impacting everything from pricing strategies to government policy.
The Core Concepts of Indifference Curves
At its heart, the indifference curve is built upon a set of core assumptions about consumer preferences. These assumptions are crucial for the logical construction and interpretation of the curves themselves. By understanding these underpinnings, we can better appreciate the insights they offer into economic decision-making.
Understanding Utility and Preferences
Before delving into the curves themselves, it’s essential to grasp the concept of utility. In economics, utility refers to the satisfaction or benefit a consumer derives from consuming a good or service. This is a subjective measure; what provides high utility to one person might provide less to another. Indifference curves assume that consumers can rank their preferences. They can determine whether they prefer one bundle of goods over another, or if they are indifferent between them.
The key assumption is transitivity. If a consumer prefers bundle A to bundle B, and bundle B to bundle C, then they must also prefer bundle A to bundle C. This ensures a consistent and logical ordering of preferences. Another important assumption is non-satiation, meaning consumers generally prefer more of a good to less. While there can be diminishing marginal utility (the extra satisfaction from consuming one more unit decreases), the general desire for more is assumed.
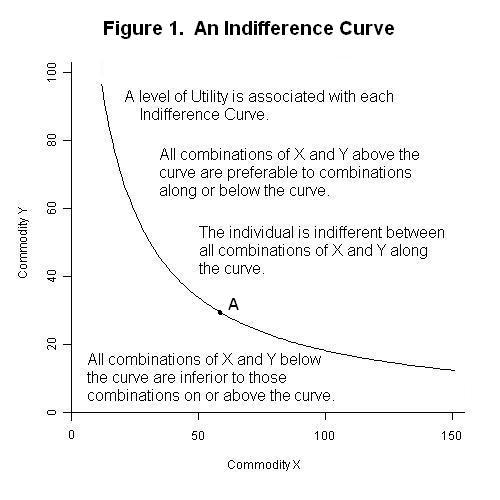
The Anatomy of an Indifference Curve
An indifference curve plots combinations of two goods on a graph. Let’s consider two hypothetical goods: apples and bananas. An indifference curve would show various combinations of apples and bananas that yield the same total satisfaction for a consumer. For example, one point on the curve might represent 10 apples and 2 bananas, while another point on the same curve might represent 5 apples and 5 bananas. If the consumer is indifferent between these two combinations, both points lie on the same indifference curve.
Key Characteristics of Indifference Curves
Indifference curves possess several distinct characteristics that are fundamental to their analysis:
- Downward Sloping: Indifference curves are typically downward sloping. This is a direct consequence of the non-satiation assumption. To maintain the same level of utility, if a consumer consumes more of one good, they must consume less of the other. For instance, if a consumer increases their consumption of apples, they must decrease their consumption of bananas to remain equally satisfied.
- Convex to the Origin: Indifference curves are usually convex, meaning they bulge towards the origin. This convexity reflects the principle of diminishing marginal rate of substitution. As a consumer has more of one good, they are willing to give up progressively fewer units of the other good to gain one more unit of the first. For example, a consumer who has many apples and few bananas might be willing to trade 3 bananas for one extra apple. However, if they have few apples and many bananas, they might only be willing to trade 1 banana for an extra apple.
- Do Not Intersect: Indifference curves for a single consumer do not intersect. If two indifference curves were to intersect, it would imply a contradiction in the consumer’s preferences, violating the transitivity assumption. Imagine an intersection point. This point would represent a specific combination of goods. If it lies on two different indifference curves, it would mean that this single combination provides two different levels of utility, which is logically impossible under the standard assumptions of consumer theory.
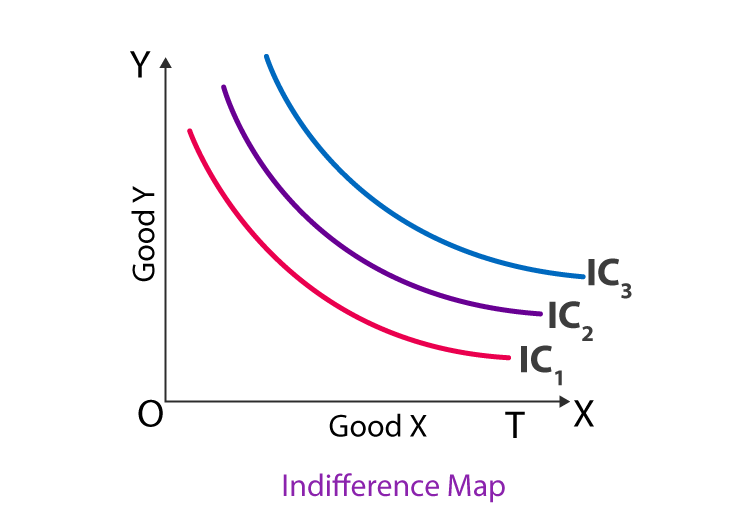
- Higher Curves Represent Higher Utility: Indifference curves that are further away from the origin represent higher levels of utility or satisfaction. A consumer would always prefer to be on a higher indifference curve, as it signifies a greater overall consumption of goods, assuming non-satiation.
The Budget Constraint: The Reality of Scarcity
While indifference curves map out a consumer’s preferences and desired satisfaction levels, they don’t operate in a vacuum. The reality of limited income and the prices of goods impose a significant constraint on what a consumer can actually purchase. This is where the budget constraint comes into play, interacting with indifference curves to determine optimal consumption choices.
Defining the Budget Line
The budget line, also known as the budget constraint, represents all the possible combinations of two goods that a consumer can afford given their income and the prices of the two goods. It is a straight line (assuming constant prices) with a downward slope, indicating that to buy more of one good, the consumer must buy less of the other, given their fixed budget.
The equation of the budget line can be expressed as:
$PX * X + PY * Y = M$
Where:
- $P_X$ is the price of good X
- $X$ is the quantity of good X
- $P_Y$ is the price of good Y
- $Y$ is the quantity of good Y
- $M$ is the consumer’s income
The slope of the budget line is given by $-PX / PY$, representing the rate at which the market allows the consumer to trade one good for another.
Interaction with Indifference Curves: The Equilibrium Point
The combination of indifference curves and the budget constraint allows us to identify the optimal consumption bundle for a consumer. This optimal bundle occurs at the point where the budget line is tangent to the highest attainable indifference curve.
At this tangency point, two conditions are met:
- Affordability: The consumer can afford this combination of goods, as it lies on their budget line.
- Maximizing Utility: The consumer is achieving the highest possible level of satisfaction given their budget. Moving to any higher indifference curve would be unaffordable, and any lower indifference curve would represent a less desirable outcome.
This point of tangency signifies the consumer’s equilibrium, where they have allocated their income in a way that maximizes their utility. The marginal rate of substitution (MRS) between the two goods (the slope of the indifference curve) is equal to the price ratio of the two goods (the slope of the budget line) at this point.
Applications and Implications of Indifference Curve Analysis
The theoretical framework of indifference curves and budget constraints has far-reaching implications and practical applications across various fields of economics and business. It provides a robust foundation for understanding consumer behavior and its impact on markets.
Understanding Consumer Demand
Indifference curve analysis is instrumental in deriving the law of demand. By examining how changes in prices or income affect the optimal consumption bundle, economists can illustrate how the quantity demanded of a good changes.
- Price Changes: If the price of one good falls, the budget line pivots outwards, allowing the consumer to potentially reach a higher indifference curve. This typically leads to an increase in the consumption of the now cheaper good (the substitution effect) and potentially an increase in the consumption of the other good as well, due to increased purchasing power (the income effect). The combined effect results in a lower price leading to a higher quantity demanded, as predicted by the law of demand.
- Income Changes: An increase in income shifts the budget line outwards parallel to its original position. This allows the consumer to reach a higher indifference curve and consume more of both goods (assuming they are normal goods). Conversely, a decrease in income shifts the budget line inwards, leading to reduced consumption.
Implications for Business and Marketing
Businesses can leverage the insights from indifference curve analysis to make more informed strategic decisions.
- Pricing Strategies: Understanding how consumers perceive the trade-offs between different goods can inform pricing. If a product is seen as a close substitute for another, businesses might need to be more competitive with their pricing. Conversely, if a product offers unique value, it might command a premium.
- Product Differentiation: By understanding what aspects of a product (features, quality, brand perception) contribute to its utility, companies can focus on differentiating their offerings to appeal to specific consumer preferences and move consumers onto higher indifference curves.
- Market Segmentation: Different consumer groups will have different preferences and budget constraints. Analyzing these variations can help businesses identify and target specific market segments with tailored products and marketing messages.
Policy Decisions and Welfare Economics
Governments and policymakers can also benefit from indifference curve analysis.
- Taxation and Subsidies: Understanding how taxes and subsidies affect consumer choices and overall welfare is crucial. For example, a tax on a good might shift the budget line, leading to a less optimal consumption bundle and potentially a reduction in consumer welfare. Subsidies, conversely, can improve affordability and welfare.
- Welfare Comparisons: While individual utility is subjective, indifference curve analysis can help compare the welfare of different groups of people or the impact of economic changes on societal well-being, by examining shifts in attainable indifference curves.
In conclusion, the indifference curve is a fundamental concept in economics that provides a graphical representation of consumer preferences. By combining these preference maps with the reality of budget constraints, economists can analyze how consumers make optimal choices to maximize their satisfaction. This theoretical framework has broad applications, offering valuable insights for businesses seeking to understand their customers and for policymakers aiming to shape economic outcomes.
aViewFromTheCave is a participant in the Amazon Services LLC Associates Program, an affiliate advertising program designed to provide a means for sites to earn advertising fees by advertising and linking to Amazon.com. Amazon, the Amazon logo, AmazonSupply, and the AmazonSupply logo are trademarks of Amazon.com, Inc. or its affiliates. As an Amazon Associate we earn affiliate commissions from qualifying purchases.