For the modern investor, few tickers carry as much weight, volatility, and potential as NVDA. When asking “what is NVIDIA trading at,” one is not merely looking for a real-time decimal point on a brokerage app; they are asking for a temperature check on the entire semiconductor sector, the artificial intelligence revolution, and the broader health of the Nasdaq. NVIDIA has transformed from a niche hardware manufacturer for gamers into a cornerstone of the global financial markets. To understand its trading price is to understand the complex intersection of supply chains, institutional sentiment, and the aggressive valuation of future earnings.
The Financial Metrics Defining NVIDIA’s Current Price Point
To grasp what NVIDIA is trading at, one must look beyond the share price and into the fundamental ratios that institutional investors use to justify its multi-trillion-dollar market capitalization. NVIDIA’s valuation is rarely “cheap” by traditional standards, but its growth trajectory often recalibrates what “expensive” means in the context of high-growth tech.
Market Capitalization and Share Value
NVIDIA’s ascent into the elite club of companies with a market cap exceeding $2 trillion (and occasionally $3 trillion) has fundamentally changed its trading dynamics. At these levels, the share price is influenced heavily by index-tracking funds and ETFs. Because NVIDIA holds such a significant weight in the S&P 500 and the Nasdaq-100, any movement in its trading price has a systemic impact on the retirement accounts of millions of people, regardless of whether they own the individual stock.
The Role of P/E Ratios and Forward Guidance
The Price-to-Earnings (P/E) ratio is the primary lens through which the market views NVDA. Historically, NVIDIA has traded at high multiples, often exceeding 70x or 100x trailing earnings during periods of extreme hype. However, the more critical metric for traders is the Forward P/E. Because NVIDIA’s earnings have grown at triple-digit percentages in recent quarters, a high current price often translates to a much more reasonable forward-looking valuation. Investors trading NVDA today are essentially betting on the company’s ability to meet or exceed its own aggressive revenue guidance.
Macroeconomic Factors Influencing NVDA Trading Levels
No stock exists in a vacuum. Even a powerhouse like NVIDIA is subject to the gravitational pull of the global economy. When we analyze its trading range, we must account for the “cost of money” and the geopolitical environment.
Interest Rates and Growth Stock Valuations
As a growth-oriented company, NVIDIA’s valuation is sensitive to the Federal Reserve’s interest rate policy. In a high-interest-rate environment, the “discount rate” applied to future cash flows increases, which can suppress the current trading price of tech stocks. Conversely, when the market anticipates rate cuts, liquidity flows back into high-beta assets like NVIDIA, driving the price upward. Professional traders keep a close eye on the 10-year Treasury yield as a leading indicator of where NVDA might trade in the short term.
Geopolitical Tensions and Semiconductor Legislation
NVIDIA’s trading price is also a reflection of international relations, specifically between the U.S. and China. Export restrictions on high-end AI chips can cause immediate dips in the stock price. Furthermore, the “CHIPS Act” and domestic manufacturing initiatives in the U.S. and Europe influence long-term capital expenditure expectations. Investors price in the risks of supply chain disruptions in Taiwan, making the stock a barometer for geopolitical stability in the Pacific.
Revenue Streams and Growth Catalysts
To understand why NVIDIA trades where it does, one must dissect where its money comes from. The shift in its revenue mix over the last five years is nothing short of a structural revolution in the business world.
Data Center Dominance
The “Data Center” segment is currently the most significant driver of NVIDIA’s stock price. As cloud service providers (CSPs) like Microsoft, Google, and Amazon race to build out their AI infrastructure, NVIDIA’s H100 and Blackwall chips have become the “digital gold” of the 21st century. When NVIDIA reports its quarterly earnings, the market looks specifically at Data Center revenue. If this segment shows even a slight deceleration, the trading price can react violently, as the market prices in a “peak AI” scenario.
Gaming and Professional Visualization
While Data Centers are the current darling of Wall Street, NVIDIA’s roots in gaming remain a multi-billion-dollar foundation. The gaming segment provides a steady floor for the stock’s valuation. Additionally, the “Professional Visualization” and “Automotive” sectors represent the “long-tail” of NVIDIA’s growth. The integration of AI into self-driving technology and industrial “digital twins” (Omniverse) offers future revenue streams that allow the stock to maintain a premium valuation even when hardware cycles fluctuate.
Technical Analysis and Investor Sentiment
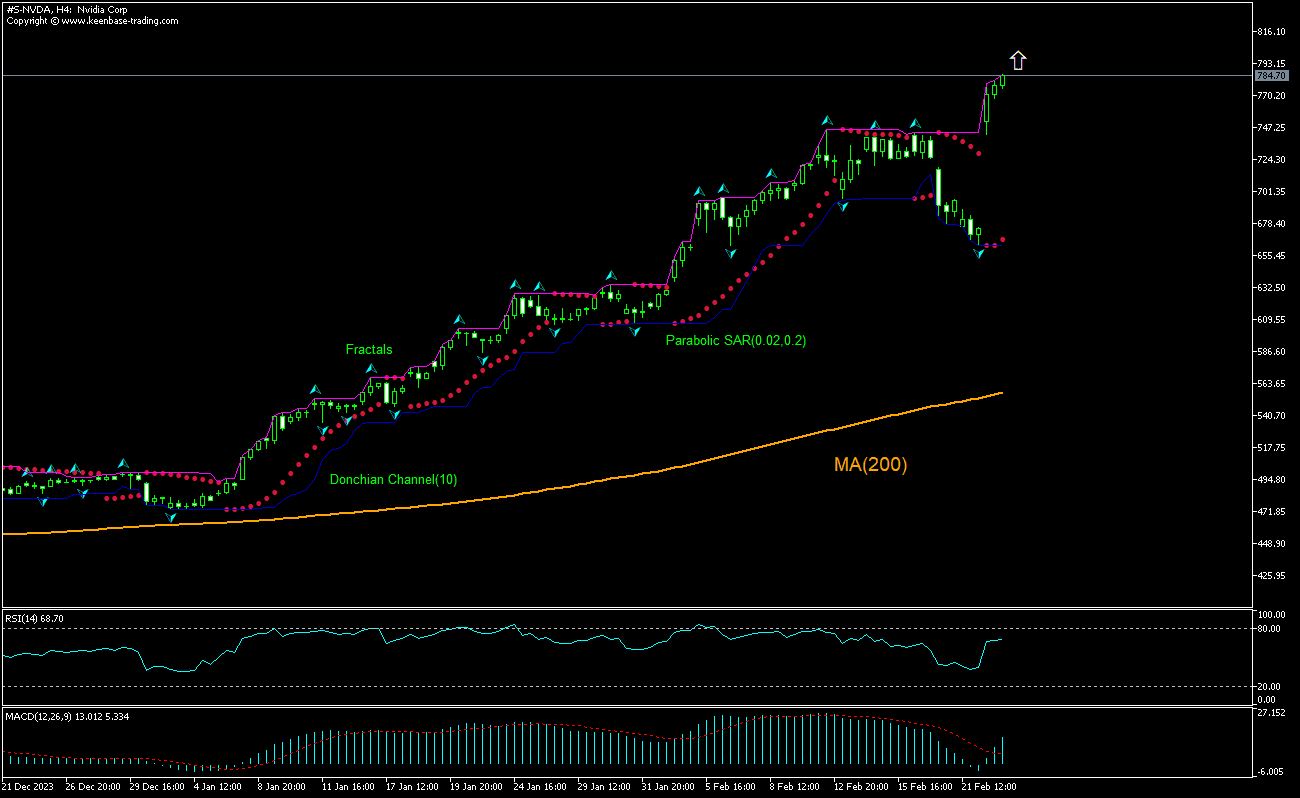
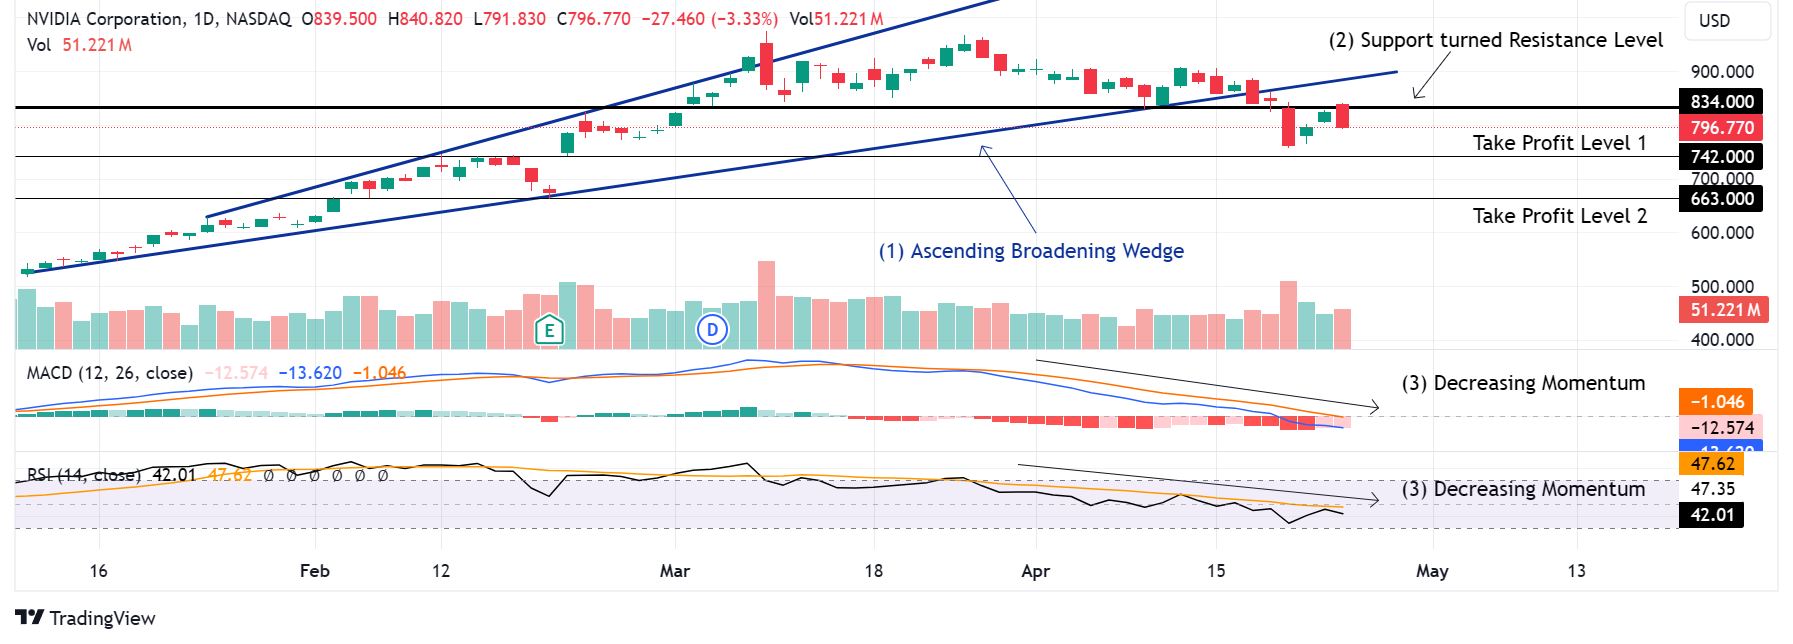
For active traders, “what NVIDIA is trading at” is a question answered by charts, moving averages, and psychological price levels. Because NVDA is one of the most liquid stocks in the world, it often obeys technical patterns more closely than smaller, less-traded equities.
Support and Resistance Levels
Technical analysts look for “support” (prices where buyers historically step in) and “resistance” (prices where sellers usually take profits). Following a stock split, which NVIDIA has utilized to keep share prices accessible to retail investors, these psychological levels reset. For example, round numbers like $100 or $500 (pre-split) often act as significant psychological barriers. When NVIDIA breaks through a major resistance level on high volume, it often signals a new “leg up” in its long-term bullish trend.
The Impact of Institutional Investing and Option Volume
A massive portion of NVIDIA’s daily trading volume comes from institutional players—hedge funds, pension funds, and mutual funds. Furthermore, NVIDIA is a favorite for options traders. Large “gamma squeezes,” where market makers are forced to buy shares to hedge the calls being bought by speculators, can lead to parabolic price moves. Understanding the “options chain” is essential for anyone trying to predict the short-term volatility of NVIDIA’s trading price.
Risk Assessment for Potential Investors
Investing in NVIDIA is not a one-way street to wealth. High rewards come with commensurate risks, and the stock’s trading history is punctuated by significant drawdowns.
Market Volatility and Sector Rotation
The semiconductor industry is notoriously cyclical. While the AI boom feels permanent, history suggests that periods of massive capital over-investment are often followed by “digestion periods” where demand wanes. If the market shifts from “Growth” stocks to “Value” or “Defensive” stocks (a process known as sector rotation), NVIDIA’s price can drop even if the company continues to perform well. Investors must be prepared for 20% to 30% corrections, which are common in NVIDIA’s trading lifecycle.

Long-term vs. Short-term Financial Outlook
For the long-term investor, the daily “trading at” price is less important than the company’s moat. NVIDIA’s software ecosystem, CUDA, makes it difficult for competitors like AMD or Intel to displace them, even if they produce comparable hardware. However, for the short-term trader, the “Money” niche requires strict risk management. Setting stop-loss orders and understanding the correlation between NVIDIA and the “Magnificent Seven” stocks is vital to preserving capital in a volatile market.
In conclusion, NVIDIA is trading at a price that reflects its status as the primary arms dealer in the AI arms race. Its valuation is a complex blend of current earnings explosions, future growth projections, and the macroeconomic environment of interest rates and global trade. Whether one views it as an overextended bubble or a generational investment opportunity, NVIDIA remains the most watched and influential ticker in the financial world today. Tracking its price is no longer just for tech enthusiasts; it is a fundamental requirement for anyone engaged in the modern financial markets.
aViewFromTheCave is a participant in the Amazon Services LLC Associates Program, an affiliate advertising program designed to provide a means for sites to earn advertising fees by advertising and linking to Amazon.com. Amazon, the Amazon logo, AmazonSupply, and the AmazonSupply logo are trademarks of Amazon.com, Inc. or its affiliates. As an Amazon Associate we earn affiliate commissions from qualifying purchases.