Discounted Cash Flow (DCF) is a valuation method used to estimate the value of an investment based on its expected future cash flows. It’s a cornerstone of financial analysis, particularly in the realm of investing and business valuation. At its core, DCF seeks to answer a fundamental question: “What is this asset or business worth today, considering the money it’s expected to generate in the future?”
The principle behind DCF is the time value of money. A dollar today is worth more than a dollar in the future because of its potential earning capacity. Inflation, opportunity cost, and risk all contribute to this difference. Therefore, future cash flows, which are inherently less certain and less valuable than current cash, need to be “discounted” back to their present value. This process allows investors and analysts to compare investments with different cash flow profiles on an apples-to-apples basis.
DCF is widely employed by a variety of financial professionals, including equity analysts, investment bankers, and corporate finance managers. It’s particularly useful for valuing companies, stocks, bonds, real estate, and any other asset that is expected to generate a stream of future income. While the concept might seem straightforward, its practical application involves several key components and assumptions that can significantly influence the final valuation. Understanding these elements is crucial for interpreting DCF analyses accurately and for using them effectively in investment decision-making.
The Core Components of Discounted Cash Flow Analysis
At the heart of any DCF valuation are two primary components: the projected future cash flows and the discount rate. Each of these components requires careful consideration and a robust methodology to ensure the reliability of the resulting valuation.
Projecting Future Cash Flows
The first step in a DCF analysis is to forecast the cash flows that the investment is expected to generate over a specified period. This is often the most challenging and subjective part of the process, as it involves making assumptions about the future.
Defining the Cash Flow Metric
The specific type of cash flow to be projected can vary depending on the asset being valued. For a company, this typically involves projecting Free Cash Flow (FCF). FCF represents the cash a company generates after accounting for capital expenditures necessary to maintain or expand its asset base. There are a few common ways to calculate FCF, but a widely used method is:
- Unlevered Free Cash Flow (UFCF): This represents the cash flow available to all capital providers (both debt and equity holders) before any debt payments are made. It’s calculated as:
- Earnings Before Interest and Taxes (EBIT) * (1 – Tax Rate) + Depreciation & Amortization – Capital Expenditures – Change in Net Working Capital.
UFCF is often preferred for DCF because it allows for the valuation of the entire business enterprise, which can then be adjusted for debt to arrive at equity value.
- Earnings Before Interest and Taxes (EBIT) * (1 – Tax Rate) + Depreciation & Amortization – Capital Expenditures – Change in Net Working Capital.
The Projection Period
Analysts typically project cash flows for a discrete period, often ranging from five to ten years. This period is chosen to be long enough for the company or asset to reach a more stable and predictable growth phase. Beyond this explicit forecast period, a terminal value is calculated to capture the value of cash flows extending into perpetuity.
Assumptions and Drivers
The accuracy of projected cash flows hinges on a multitude of assumptions about future economic conditions, industry trends, competitive landscape, management strategies, and the company’s own operational efficiency. Key drivers that influence cash flow projections include:
- Revenue Growth: Predicting the rate at which sales will increase, considering market size, market share, pricing strategies, and new product development.
- Profit Margins: Estimating the profitability of sales, influenced by cost of goods sold, operating expenses, and pricing power.
- Capital Expenditures (CapEx): Forecasting investments in long-term assets like property, plant, and equipment, which are necessary for growth and maintenance.
- Working Capital Management: Anticipating changes in current assets and liabilities (e.g., inventory, accounts receivable, accounts payable) that impact operational cash flow.
- Depreciation and Amortization: Estimating non-cash expenses that reduce taxable income.
Determining the Discount Rate
The discount rate is used to bring future cash flows back to their present value. It reflects the riskiness of the investment and the required rate of return an investor expects to earn. A higher discount rate implies greater risk or higher opportunity cost, leading to a lower present value.
The Weighted Average Cost of Capital (WACC)
For company valuations, the most common discount rate used is the Weighted Average Cost of Capital (WACC). WACC represents the average rate of return a company expects to pay to all its security holders to finance its assets. It’s calculated as:
- WACC = (E/V) * Re + (D/V) * Rd * (1 – Tc)
Where:
- E: Market value of the company’s equity
- D: Market value of the company’s debt
- V: Total market value of the company (E + D)
- Re: Cost of equity
- Rd: Cost of debt
- Tc: Corporate tax rate
Components of WACC
- Cost of Equity (Re): This is the return required by equity investors. The most common method to estimate the cost of equity is the Capital Asset Pricing Model (CAPM):
- Re = Rf + β * (Rm – Rf)
Where:- Rf: Risk-free rate (e.g., yield on long-term government bonds)
- β (Beta): A measure of the stock’s volatility relative to the overall market. A beta of 1 means the stock moves with the market; a beta greater than 1 means it’s more volatile; less than 1 means it’s less volatile.
- (Rm – Rf): Market risk premium, the expected return of the market over the risk-free rate.
- Re = Rf + β * (Rm – Rf)
- Cost of Debt (Rd): This is the interest rate a company pays on its borrowings. It’s typically determined by the company’s credit rating and prevailing market interest rates. The cost of debt is adjusted for taxes because interest payments are tax-deductible, creating a “tax shield.”
The WACC effectively represents the blended cost of financing for the company, taking into account both equity and debt.
Calculating the Present Value and Terminal Value
Once the future cash flows and the discount rate are determined, the next step is to calculate the present value of these cash flows and then incorporate the terminal value to arrive at the total estimated value.
Discounting Future Cash Flows
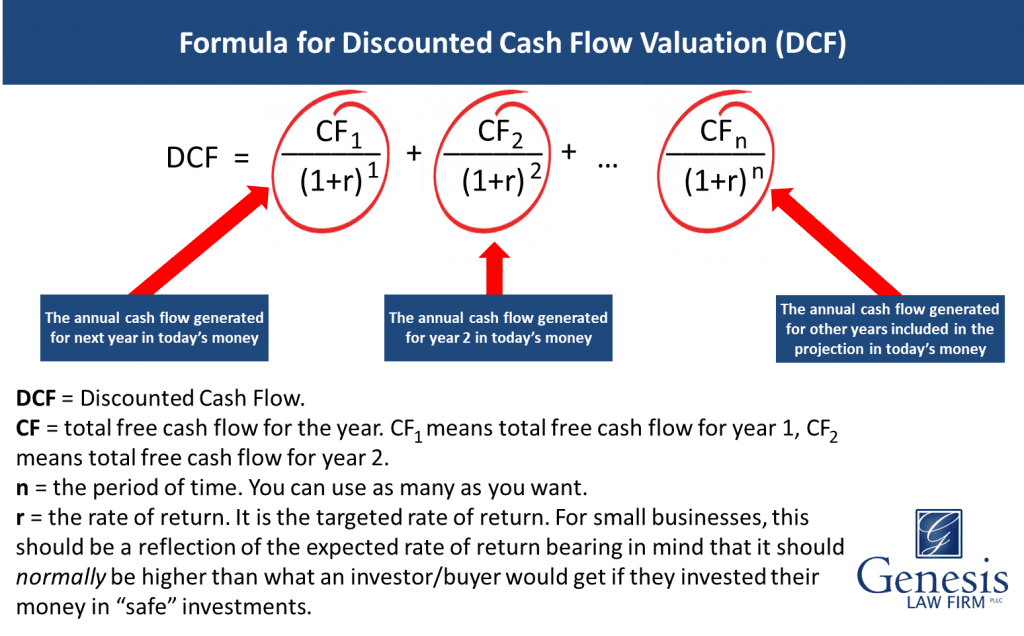
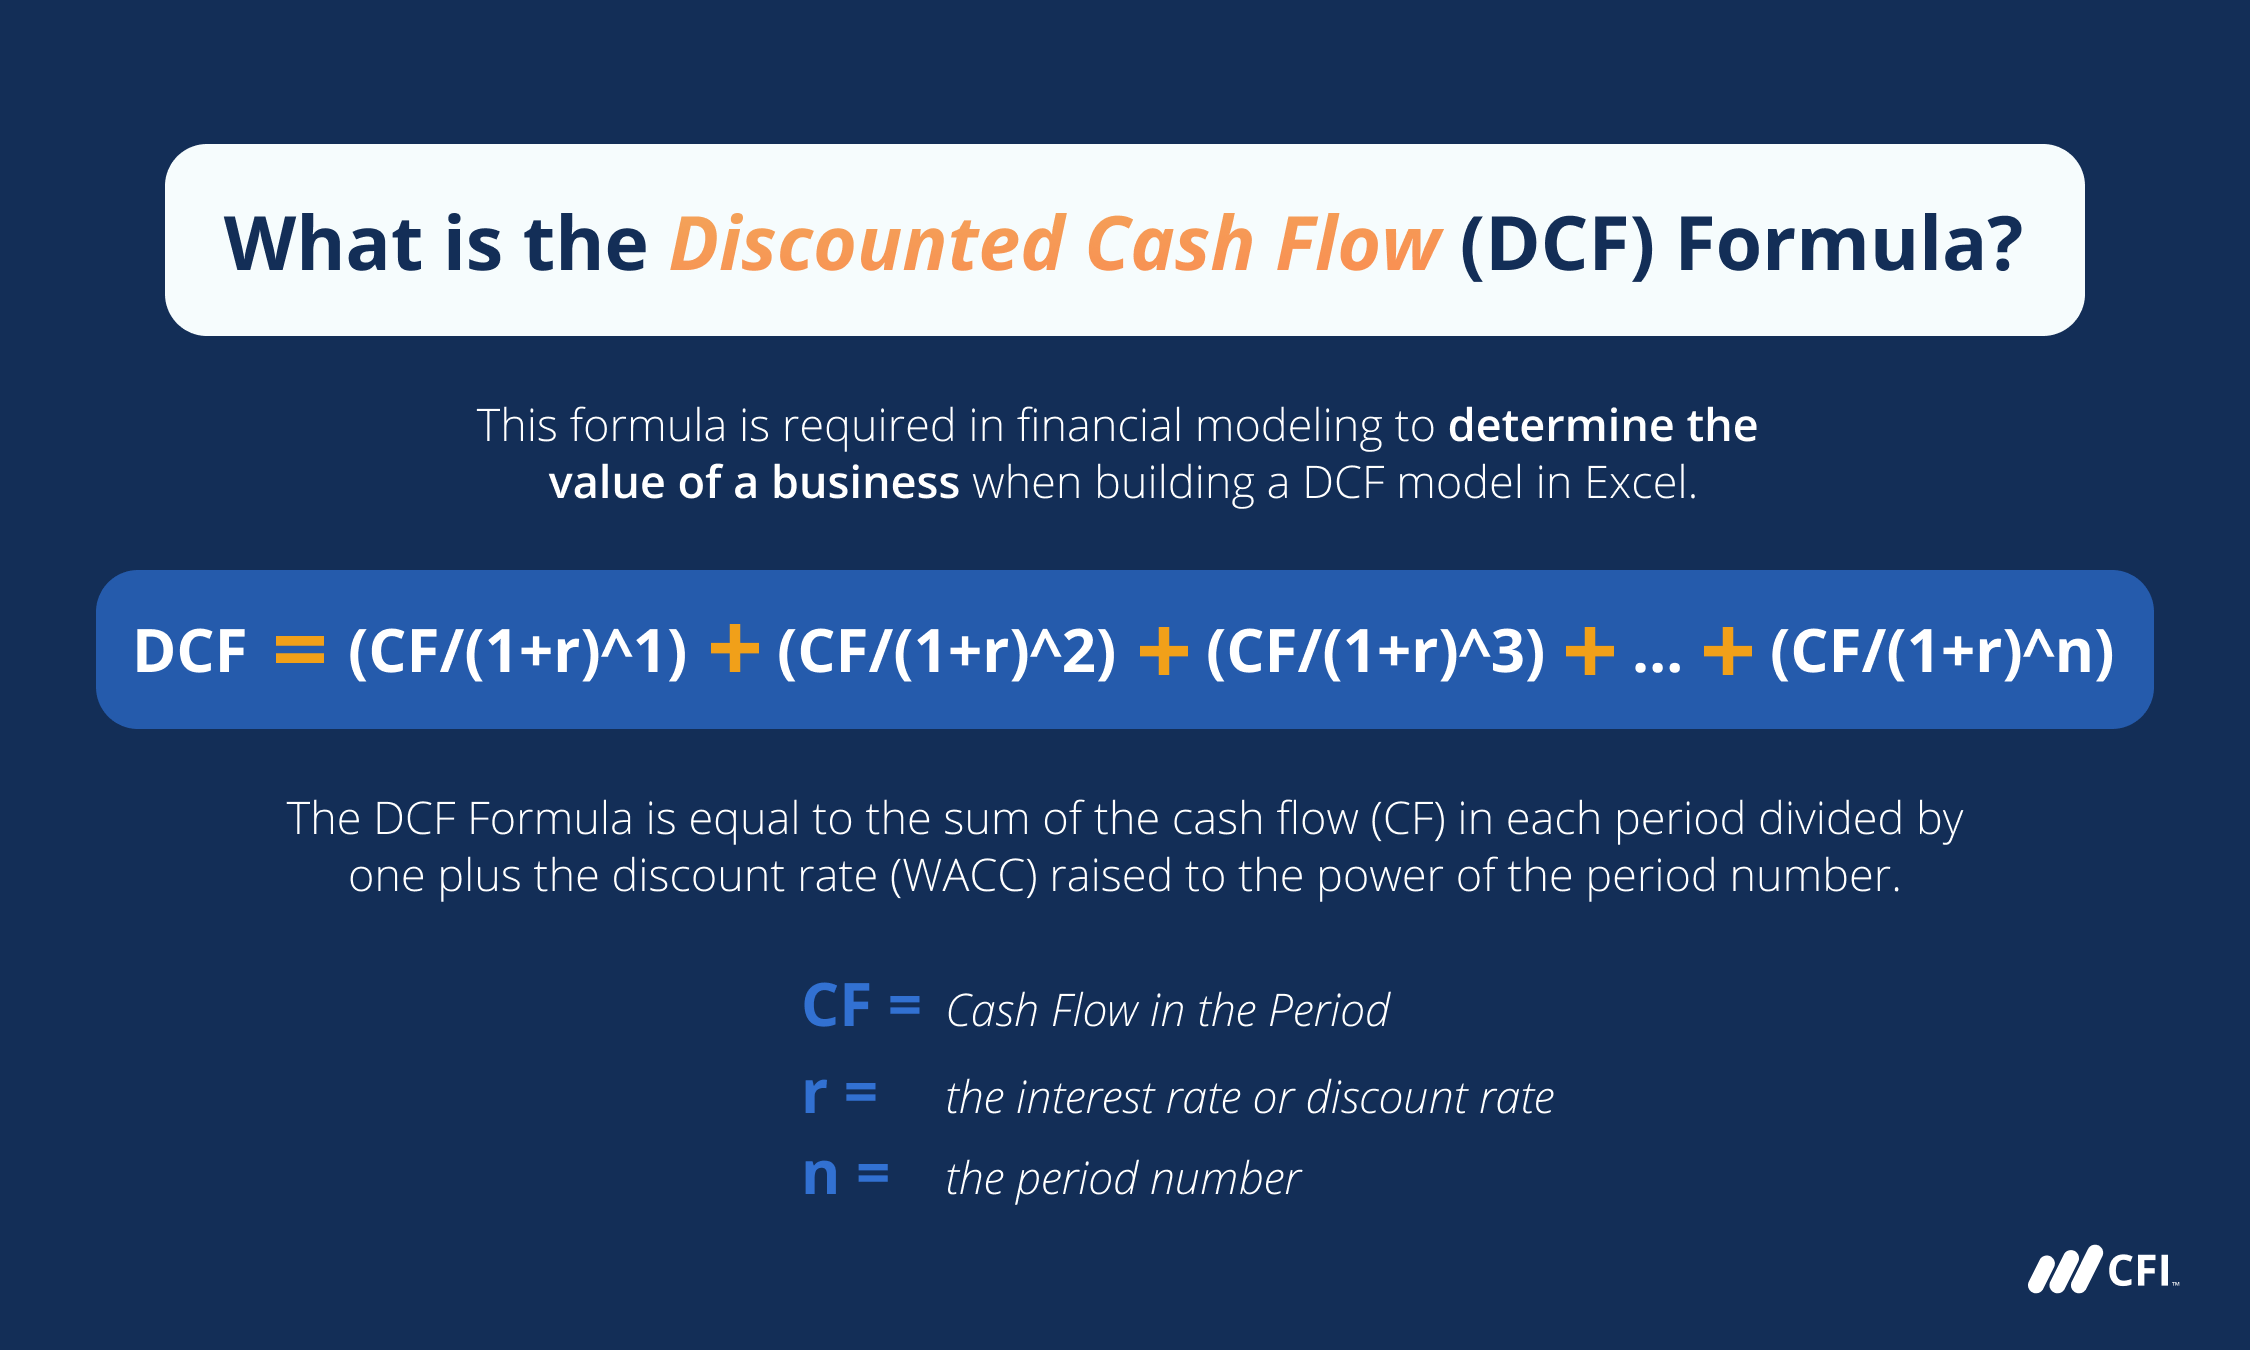
Each projected cash flow is discounted back to its present value using the chosen discount rate. The formula for present value is:
- PV = CFt / (1 + r)^t
Where:
- PV: Present Value
- CFt: Cash Flow in period ‘t’
- r: Discount rate (WACC)
- t: The period in which the cash flow occurs
This process is repeated for each year within the explicit forecast period. The sum of these individual present values represents the present value of the cash flows expected during that explicit forecast horizon.
Estimating the Terminal Value
The explicit forecast period typically covers 5-10 years, but businesses are generally assumed to operate beyond this timeframe. The terminal value (TV) represents the present value of all cash flows beyond the explicit forecast period, extending into perpetuity. There are two primary methods for calculating terminal value:
- The Gordon Growth Model (GGM): This model assumes that the company’s cash flows will grow at a constant rate indefinitely. The formula is:
- TV = CF(n+1) / (r – g)
Where:- CF(n+1): The cash flow in the first year after the explicit forecast period. This is often calculated by growing the last projected cash flow by the perpetual growth rate.
- r: The discount rate (WACC).
- g: The perpetual growth rate, which should be a sustainable, long-term growth rate (typically not exceeding the expected long-term economic growth rate).
- TV = CF(n+1) / (r – g)
- The Exit Multiple Method: This method assumes that the company will be sold at the end of the forecast period at a certain valuation multiple (e.g., Enterprise Value to EBITDA or Price to Earnings). The multiple is typically based on comparable companies in the same industry.
- TV = Financial Metric (e.g., EBITDA) * Exit Multiple
The terminal value is a significant component of the total valuation, and its calculation is highly sensitive to the assumptions made.
Deriving the Enterprise and Equity Value
The culmination of the DCF process is the calculation of the investment’s total value, which can then be broken down into enterprise value and equity value.
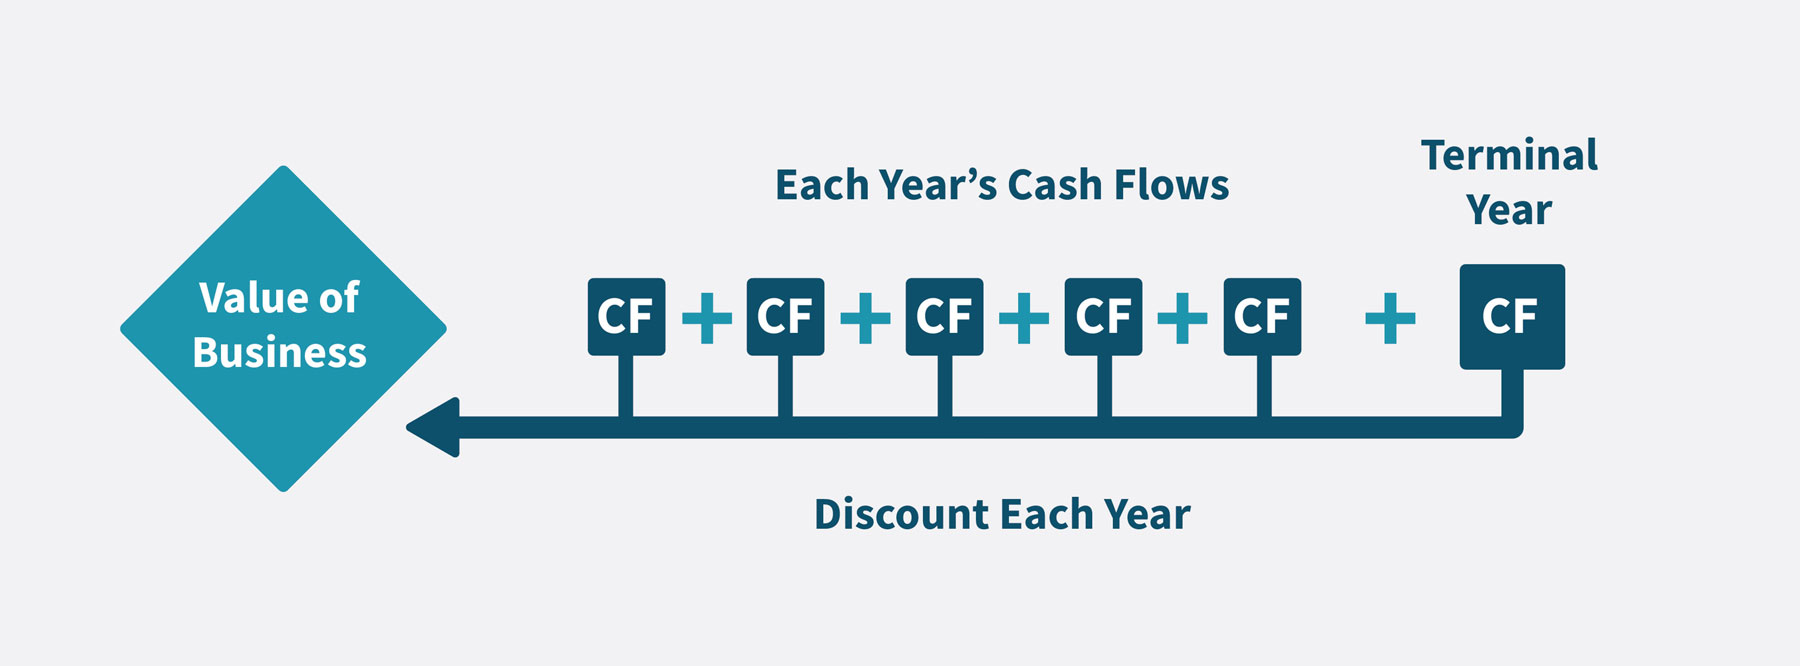
Summing Present Values to Determine Enterprise Value
The total enterprise value (EV) of the business is the sum of the present values of all projected future cash flows (during the explicit forecast period) plus the present value of the terminal value.
- Enterprise Value = (PV of Explicit Forecast Period Cash Flows) + (PV of Terminal Value)
Enterprise Value represents the total value of the company’s operations, irrespective of its capital structure. It’s the theoretical price at which an entire company could be acquired.
Adjusting for Debt and Other Items to Reach Equity Value
To arrive at the equity value, adjustments are made to the enterprise value. Equity value represents the value attributable to the company’s shareholders.
- Equity Value = Enterprise Value – Total Debt – Preferred Stock – Minority Interest + Cash and Cash Equivalents
This final step subtracts all claims senior to common equity (like debt and preferred stock) and adds back non-operating assets (like excess cash) to arrive at the value of the shareholders’ stake in the company. This equity value can then be divided by the number of outstanding shares to determine the intrinsic value per share, which can be compared to the current market price to assess whether the stock is undervalued, overvalued, or fairly priced.
Strengths, Weaknesses, and Applications of DCF
While DCF is a powerful valuation tool, it’s essential to understand its advantages and limitations to use it effectively and interpret its results appropriately.
Strengths of the DCF Model
The DCF method is a fundamental tool in finance for several compelling reasons:
- Intrinsic Value Focus: DCF attempts to determine the intrinsic value of an investment based on its underlying cash-generating ability, rather than relying solely on market comparisons or historical performance. This focus on fundamental drivers makes it a robust method for long-term valuation.
- Flexibility: The model can be adapted to value a wide range of assets, from individual stocks and bonds to entire companies, projects, and even intangible assets.
- Scenario Analysis: DCF allows for sensitivity analysis and scenario planning. By altering key assumptions (e.g., growth rates, discount rates), analysts can assess how different outcomes might impact the valuation. This provides a more nuanced understanding of the risks and potential rewards.
- Forces Fundamental Thinking: The process of building a DCF model compels analysts to deeply understand the business, its competitive environment, and the key drivers of its future performance.
Weaknesses and Limitations of DCF
Despite its strengths, DCF analysis is not without its drawbacks, primarily stemming from its reliance on future projections:
- Sensitivity to Assumptions: The valuation is highly sensitive to the assumptions made regarding future cash flows and the discount rate. Small changes in these inputs can lead to significant variations in the final valuation. This is often referred to as the “garbage in, garbage out” principle.
- Forecasting Difficulty: Accurately forecasting cash flows, especially over extended periods, is incredibly challenging. Unforeseen economic events, technological disruptions, or competitive shifts can render projections obsolete.
- Terminal Value Dominance: In many DCF models, the terminal value represents a substantial portion of the total valuation. Errors in the terminal value calculation can disproportionately impact the overall result.
- Assumes Rational Markets: The model implicitly assumes that the market will eventually recognize the intrinsic value. It doesn’t account for short-term market inefficiencies or behavioral biases that can cause assets to trade at prices significantly different from their DCF-derived values for extended periods.
Key Applications in Finance
The DCF methodology is a versatile tool with broad applications across the financial landscape:
- Equity Valuation: Determining the intrinsic value of a company’s stock to guide investment decisions (buy, sell, hold).
- Mergers and Acquisitions (M&A): Valuing a target company to determine a fair acquisition price.
- Corporate Finance: Evaluating the potential returns of capital budgeting projects and investment opportunities to support strategic decision-making.
- Real Estate Investment: Estimating the value of properties based on projected rental income and resale value.
- Bond Valuation: While less common than for equities, DCF can be used to value bonds based on their coupon payments and principal repayment.
In conclusion, Discounted Cash Flow is a powerful and fundamental valuation technique that provides a framework for understanding the intrinsic worth of an investment. By meticulously projecting future cash flows and discounting them back to their present value using an appropriate rate, investors and analysts can gain critical insights into an asset’s potential. However, its effectiveness hinges on the quality of its inputs and the analyst’s ability to make reasoned assumptions about the future. When applied thoughtfully and complemented by other valuation methods, DCF remains an indispensable tool in the financial professional’s arsenal.
aViewFromTheCave is a participant in the Amazon Services LLC Associates Program, an affiliate advertising program designed to provide a means for sites to earn advertising fees by advertising and linking to Amazon.com. Amazon, the Amazon logo, AmazonSupply, and the AmazonSupply logo are trademarks of Amazon.com, Inc. or its affiliates. As an Amazon Associate we earn affiliate commissions from qualifying purchases.