In the contemporary digital landscape, the ability to visualize data is a fundamental skill that bridges the gap between abstract logic and actionable insight. At the heart of this visualization lies the linear equation—a mathematical staple that defines the relationship between two variables. While traditional methods involved graph paper and a straightedge, the modern professional and student now leverage a sophisticated suite of technology to accomplish this task. This guide explores the technological ecosystem of graphing linear equations, focusing on the software, AI tools, and digital platforms that have revolutionized mathematical modeling.

1. The Digital Evolution of Graphing: From Static Paper to Interactive Interfaces
The transition from manual graphing to digital visualization represents a significant leap in cognitive efficiency. In the past, graphing a linear equation required manual calculations of intercepts and slopes, a process prone to human error. Today, technology has transformed the coordinate plane into a dynamic, interactive canvas.
The Shift Toward Interactive Visualization
Modern software does more than just plot points; it allows for real-time manipulation of variables. When we talk about how to graph a linear equation in a tech context, we are referring to the use of “dynamic geometry environments” (DGEs). These platforms allow users to drag sliders to change the value of $m$ (slope) or $b$ (y-intercept) and see the line adjust instantaneously. This immediate feedback loop is essential for understanding the sensitivity of models in fields like software engineering and data analysis.
Why Tech-Driven Graphing Matters in Data Science
In the realm of technology trends, linear equations are the building blocks of machine learning algorithms, specifically linear regression. Understanding how to graph these equations using digital tools is a prerequisite for anyone entering the fields of AI or big data. Digital graphing allows for the overlay of multiple datasets, the calculation of residuals, and the visualization of “lines of best fit” across thousands of data points—tasks that are impossible to perform manually.
2. Essential Software for Graphing Linear Equations
Selecting the right software is the first step in mastering digital graphing. Depending on the complexity of the project, a user might choose between browser-based tools, dedicated desktop applications, or mobile software.
Desmos and GeoGebra: The Web-Based Powerhouses
Desmos has emerged as the gold standard for intuitive, web-based graphing. Its sleek interface allows users to type equations in standard, slope-intercept, or point-slope forms. The “Tech” advantage of Desmos lies in its cloud-based architecture, enabling users to save, share, and embed graphs into websites or digital presentations.
GeoGebra, on the other hand, offers a more robust suite of tools for those who need to integrate linear equations with geometry, algebra, and calculus. It is an indispensable tool for developers who need to model spatial relationships within software environments.
The Modern Graphing Calculator: TI-Nspire and Beyond
While the image of a graphing calculator might seem “old school,” the technology inside modern devices like the TI-Nspire CX II is anything but. These gadgets now feature high-resolution color displays, faster processors, and the ability to run Python code. They serve as a bridge between dedicated hardware and versatile software, offering a distraction-free environment for complex mathematical computation.
Mobile Apps for On-the-Go Calculations
The proliferation of tablets and smartphones has led to the rise of specialized apps like Photomath and Microsoft Math Solver. These apps utilize computer vision (a subset of AI) to “read” a handwritten linear equation through a camera lens and instantly generate a digital graph. This integration of optical character recognition (OCR) and graphing engines represents the cutting edge of educational technology.
3. Mastering the Logic: A Step-by-Step Digital Tutorial
To graph a linear equation using technology, one must understand how software interprets mathematical syntax. Most digital tools follow the standard $y = mx + b$ format, but they offer features that go far beyond basic plotting.
Inputting Slope-Intercept Form ($y = mx + b$)
The first step in any digital graphing tool is the input. In the software’s expression bar, you define the relationship. The beauty of modern tech is that it recognizes “parameters.” For example, if you type $y = ax + b$, the software will automatically ask if you want to “add sliders” for $a$ and $b$. This allows the user to observe how the steepness and position of the line change as the constants are modified.
Handling Standard Form and Point-Slope Form
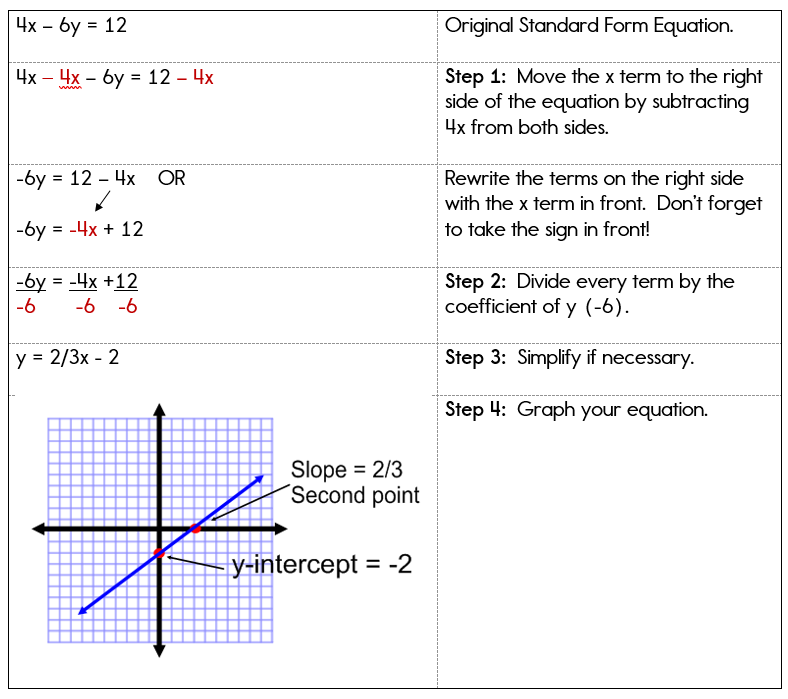
One of the primary advantages of using software over manual graphing is the ability to bypass algebraic rearrangement. Traditionally, a student would have to convert $Ax + By = C$ into slope-intercept form to graph it easily. Modern graphing engines can parse standard form and point-slope form $(y – y1 = m(x – x1))$ natively. This saves computational time and reduces the risk of sign errors during conversion.
Manipulating Variables and Constraints in Real-Time
In advanced tech applications, graphing a linear equation often involves constraints. Software allows users to define “domains” and “ranges.” For instance, typing $y = 2x + 3 {x > 0}$ tells the software to only graph the line for positive values of $x$. This is a crucial feature for software developers who are coding boundaries for user interfaces or game physics.
4. Advanced Graphing with Programming and AI
For those in the tech industry, graphing a linear equation often happens within a code editor rather than a GUI-based calculator. This allows for automation and the handling of massive datasets.
Using Python (Matplotlib and NumPy) for Automated Graphing
Python is the leading language for mathematical visualization. By using the Matplotlib library, a developer can write a script to graph a linear equation in seconds.
- The Process: Define a range of $x$ values using NumPy, apply the linear function (e.g., $y = 3x + 5$), and use the
plt.plot()function to render the image.
This method is preferred in tech because it allows the graph to be exported as a high-resolution PNG, SVG, or PDF, which can then be integrated into professional reports or UI dashboards.
Leveraging AI Tools for Equation Visualization
Artificial Intelligence has introduced a new layer of accessibility to graphing. Large Language Models (LLMs) like ChatGPT or Claude can now generate graphing code or even render the graphs directly using built-in interpreters. A user can simply prompt, “Graph a linear equation that passes through (2,3) and has a slope of -1/2,” and the AI will provide the equation, the step-by-step logic, and the visual output. This is a significant trend in “No-Code” technology, allowing non-programmers to generate complex visualizations.
Exporting and Integrating Graphs into Tech Projects
In a professional tech environment, a graph is rarely the end product; it is usually a component of a larger project. Modern tools allow for the export of “LaTeX” code for mathematical typesetting or “JSON” data for web integration. This interoperability ensures that a linear equation graphed in one tool can be seamlessly utilized in a CAD program, a web development framework, or a digital whiteboarding tool like Miro.
5. Troubleshooting and Optimizing Digital Graphs
Despite the power of modern technology, users often encounter hurdles when graphing linear equations digitally. Understanding how to optimize these visualizations is key to professional-grade output.
Resolving Scaling and Resolution Issues
A common issue in digital graphing is the “viewing window.” If an equation has a very high y-intercept (e.g., $y = x + 10,000$), the line may not appear on a standard $10 times 10$ grid. Tech-savvy users utilize “Auto-Scale” features or manually adjust the axes’ limits within the software settings. Furthermore, when preparing graphs for high-definition displays, choosing vector formats (like SVG) over raster formats (like JPG) ensures that the line remains crisp at any zoom level.
Collaborative Graphing in Cloud Environments
The future of mathematical modeling is collaborative. Tools like Google Colab allow multiple users to work on the same graphing script simultaneously, much like a Google Doc. This “Cloud Math” trend is essential for remote engineering teams and global research projects. By hosting the graphing logic in the cloud, teams ensure that everyone is looking at the same version of the linear model, complete with version control and real-time updates.

Digital Security and Data Privacy in Math Tools
As with all software, digital security is a consideration. Professional researchers must ensure that the tools they use to graph proprietary data (which may be modeled via linear equations) are secure. Many tech-focused graphing platforms now offer end-to-end encryption and private “sandboxes” to protect intellectual property, marking a shift from open-access educational tools to enterprise-grade mathematical software.
In conclusion, graphing a linear equation has evolved from a manual chore into a sophisticated technological exercise. By leveraging web-based software, mobile apps, Python programming, and AI, professionals can visualize complex relationships with unprecedented speed and accuracy. As technology continues to advance, the line between “doing math” and “developing software” will continue to blur, making these digital graphing skills more vital than ever.
aViewFromTheCave is a participant in the Amazon Services LLC Associates Program, an affiliate advertising program designed to provide a means for sites to earn advertising fees by advertising and linking to Amazon.com. Amazon, the Amazon logo, AmazonSupply, and the AmazonSupply logo are trademarks of Amazon.com, Inc. or its affiliates. As an Amazon Associate we earn affiliate commissions from qualifying purchases.