
In the fast-paced world of global finance, the question “what is the Dow Jones currently at?” is more than just a request for a number; it’s a daily ritual for investors, economists, and even the general public seeking a snapshot of the stock market’s health. The Dow Jones Industrial Average (DJIA), often simply referred to as “the Dow,” stands as one of the most recognizable and frequently quoted stock market indices worldwide. While its precise real-time value fluctuates continuously during trading hours, understanding its current level involves more than just glancing at a ticker. It requires an appreciation for what the Dow represents, how it functions, and the myriad factors that influence its daily dance. This article will delve into the essence of the Dow, exploring its historical context, its role as a market barometer, how to access its real-time data, the forces that shape its movements, and its relevance to your personal financial journey.

Decoding the Dow Jones Industrial Average (DJIA)
To truly grasp the significance of the Dow’s current standing, it’s essential to understand its foundational principles and evolution. Far from being a mere collection of stocks, the DJIA is a carefully curated index designed to reflect the performance of a segment of the U.S. stock market.
A Historical Perspective: Birth of an Icon
The Dow Jones Industrial Average was conceived by Charles Dow, a co-founder of Dow Jones & Company and The Wall Street Journal, and first published on May 26, 1896. Initially comprising just 12 industrial companies, its purpose was to provide a clear, concise measure of the performance of the most prominent U.S. industries. In an era before widespread financial data, the Dow served as an invaluable tool for tracking market trends and economic cycles. Its longevity and continuous evolution speak volumes about its enduring utility and adaptability in a constantly changing economic landscape. From its humble beginnings tracking railroads, sugar, and tobacco, it has grown to encompass companies at the forefront of modern commerce.
The “Industrial” Misnomer: Evolution of its Components
While “Industrial” remains in its name, the DJIA today is far from solely industrial. The original components were heavy industry companies, but over time, the index has adapted to reflect the changing nature of the American economy. Today, the Dow consists of 30 large, publicly traded companies chosen by the editors of The Wall Street Journal. These companies are selected not just for their size but also for their reputation, sustained growth, and broad investor interest. They represent a diverse cross-section of the U.S. economy, including technology giants, financial institutions, healthcare providers, and consumer goods companies. This ongoing re-evaluation ensures that the Dow remains relevant, even if its name hints at a bygone era of smokestacks and factories. Changes to the index are rare but significant, often reflecting major shifts in corporate America.
How the Dow is Calculated: A Price-Weighted Index
Unlike other major indices such as the S&P 500, which are market-capitalization weighted, the DJIA is a price-weighted index. This means that stocks with higher share prices have a greater influence on the index’s value than those with lower share prices, regardless of their total market capitalization. The index is calculated by summing the prices of the 30 component stocks and then dividing by a proprietary divisor, known as the “Dow Divisor.” This divisor is adjusted for stock splits, spin-offs, and other structural changes to ensure the continuity of the index’s value. Consequently, a one-dollar change in a high-priced stock like UnitedHealth Group (UNH) will have a greater impact on the Dow’s overall movement than a one-dollar change in a lower-priced stock like Walmart (WMT), even if Walmart has a larger market cap. Understanding this calculation method is crucial for interpreting the magnitude of the Dow’s daily fluctuations.
Why the Dow Jones Matters to Investors and the Economy
The Dow’s current level is not just a statistical curiosity; it serves as a critical pulse point for both the broader economy and individual investment portfolios. Its movements are scrutinized daily for a variety of reasons.
A Barometer of Economic Health
Often considered a bellwether for the overall U.S. economy, the Dow’s performance is frequently cited as an indicator of economic sentiment and corporate profitability. When the Dow rises, it often signals investor confidence in the future earnings of large corporations, suggesting a robust economic environment. Conversely, a significant decline in the Dow can point to economic headwinds, fears of recession, or a general pullback in investor optimism. While it only represents 30 companies, their sheer size and influence mean their collective performance can offer a valuable, albeit partial, insight into the nation’s economic trajectory. Policymakers, analysts, and business leaders all pay close attention to its trends for clues about the direction of the economy.
Indicator for Blue-Chip Performance
The 30 companies that comprise the Dow are often referred to as “blue chips” – well-established, financially sound companies with a history of stable earnings and reliable performance. As such, the Dow provides a snapshot of how these foundational pillars of American industry are faring. Investors looking for a quick gauge of the health of large, mature corporations often turn to the Dow. Its performance can indicate the stability and growth prospects of the companies that form the backbone of the U.S. economy, making it a key metric for conservative and growth-oriented investors alike.
Influencing Investor Sentiment and Market Trends
Beyond its direct analytical value, the Dow holds significant psychological weight. Its widely reported movements can heavily influence investor sentiment, shaping perceptions of market stability or volatility. A strong Dow can breed optimism, encouraging further investment and risk-taking, while a falling Dow can trigger anxiety, leading to sell-offs and a “flight to safety.” This interplay between the index and market psychology can create self-fulfilling prophecies, where initial movements are amplified by collective investor reactions. Furthermore, trends observed in the Dow often foreshadow or confirm broader market trends, influencing decisions across different asset classes and investment strategies.
Comparison with Other Major Indices (S&P 500, Nasdaq)
While the Dow is prominent, it’s important to view it in context alongside other major indices. The S&P 500, for instance, is a market-capitalization-weighted index comprising 500 large U.S. companies, offering a broader and often more representative view of the overall U.S. stock market. The Nasdaq Composite, heavily weighted towards technology and growth companies, provides insights into the performance of the tech sector. Each index offers a unique lens through which to view the market. Savvy investors typically monitor all three – and others – to gain a comprehensive understanding, recognizing that while the Dow is influential, it is just one piece of the intricate financial puzzle. Its narrower scope means it can sometimes move differently from the broader market, making multi-index analysis essential.
Accessing Real-Time Dow Jones Information
Knowing the Dow’s importance, the next practical step is understanding how to reliably find its current value and associated data. In today’s digital age, this information is readily available, but distinguishing between real-time data and delayed feeds is crucial.
Reliable Sources for Current Quotes
Numerous platforms provide up-to-the-minute or near real-time quotes for the Dow Jones Industrial Average.
- Financial News Websites: Major outlets like Bloomberg, Reuters, The Wall Street Journal, CNBC, and Yahoo Finance offer comprehensive market data pages that update throughout the trading day. These sites often include charts, historical data, and related news.
- Brokerage Platforms: If you have an investment account, your brokerage’s online platform or mobile app will typically provide real-time Dow quotes, often integrated with your portfolio information. These are usually the most accurate and immediate sources for active investors.
- Financial Data Aggregators: Specialized financial data services and terminals (e.g., Bloomberg Terminal, Refinitiv Eikon) offer the highest level of real-time data for professionals, though these come at a significant cost.
- Television and Radio: Financial news channels (like CNBC, Fox Business) and some radio programs provide constant updates during market hours.
Understanding Market Data Delays vs. Real-Time Feeds
It’s vital to understand the difference between delayed and real-time data. Many free financial websites provide data that is delayed by 15-20 minutes, particularly for certain exchanges or data points. While useful for general observation, this delay can be significant for active traders or those making immediate investment decisions. Truly “real-time” data, reflecting transactions as they happen, often requires a subscription or is provided by brokerage accounts that pay for direct market data feeds. Always check the disclaimer on any financial data source to ascertain whether the quotes are live or delayed.
Key Metrics to Observe Beyond the Headline Number
While the headline number of the Dow (e.g., “Dow up 150 points”) is the most commonly reported, savvy observers look at several other metrics to gain a fuller picture:
- Open: The index’s value at the start of the trading day.
- Close: The index’s value at the end of the trading day.
- High/Low: The highest and lowest values the index reached during the day, indicating volatility and range.
- Change in Points/Percentage: The net change from the previous day’s close, expressed in both absolute points and as a percentage, which provides better context for the magnitude of the movement.
- Volume: Though not directly applicable to the index itself, observing trading volume for the underlying components can indicate the conviction behind market moves.
- Year-to-Date (YTD) Performance: Provides a broader perspective on how the index has performed since the beginning of the current calendar year.
Factors Influencing the Dow Jones’ Daily Movements
The Dow’s current value is a dynamic reflection of a complex interplay of forces. Its daily gyrations are rarely random; instead, they are driven by a multitude of economic, corporate, and geopolitical factors.
Corporate Earnings and Financial Reports
The performance of the 30 companies within the Dow is heavily influenced by their quarterly and annual financial results. Strong earnings reports, positive revenue growth, and optimistic forward guidance from these blue-chip companies can send the Dow upward. Conversely, disappointing earnings, missed forecasts, or negative outlooks can trigger sharp declines. These reports offer direct insights into the profitability and health of the companies making up the index, and by extension, a significant portion of the U.S. economy.
Macroeconomic Indicators (GDP, Inflation, Unemployment)
Broader economic data plays a pivotal role. Positive economic indicators, such as robust GDP growth, low unemployment rates, and controlled inflation, tend to support higher stock prices and, consequently, a rising Dow. Conversely, signs of economic slowdown, persistent inflation, or rising unemployment can lead to investor apprehension and market downturns. Investors constantly weigh incoming economic data against expectations, adjusting their outlook on corporate profitability and overall market risk.
Geopolitical Events and Global Market Sentiment
The interconnectedness of the global economy means that events far beyond U.S. borders can impact the Dow. Geopolitical tensions, trade disputes, international conflicts, or significant policy shifts in major economies (like China or the European Union) can create uncertainty, affecting supply chains, commodity prices, and corporate revenues. This global market sentiment, often fueled by headlines, can trigger knee-jerk reactions and volatility in the Dow as investors adjust their risk exposure.
Interest Rate Decisions and Central Bank Policies
Actions by the Federal Reserve and other central banks are critical drivers of market movement. Interest rate hikes, for example, can increase borrowing costs for businesses and consumers, potentially slowing economic growth and reducing corporate profits, often leading to a pullback in the Dow. Conversely, interest rate cuts or quantitative easing measures can stimulate economic activity and boost market confidence. The Fed’s commentary and forward guidance are meticulously scrutinized for clues about future monetary policy, with profound implications for the Dow’s trajectory.
Sector-Specific News and Innovation
Even within a diversified index, specific sectors can disproportionately influence the Dow. News related to technological breakthroughs, regulatory changes affecting a particular industry (e.g., healthcare or finance), or major M&A activity involving a Dow component can have ripple effects. For instance, a major innovation from a tech component or a significant legal ruling against a pharmaceutical component can shift the entire index, highlighting the importance of sector-specific awareness.
The Dow Jones in Your Personal Finance Strategy
For individual investors, understanding the Dow Jones isn’t just an academic exercise; it has practical implications for building and managing a financial portfolio.
Direct Investing vs. Index Funds and ETFs
You cannot directly invest in the Dow Jones Industrial Average itself. Instead, investors can either buy individual shares of the 30 component companies or invest in index funds or Exchange Traded Funds (ETFs) that track the DJIA. Index funds offer a diversified way to gain exposure to the Dow’s performance without having to select and manage 30 individual stocks. This approach offers simplicity and often lower fees, aligning with a passive investing strategy.
Long-Term vs. Short-Term Trading Considerations
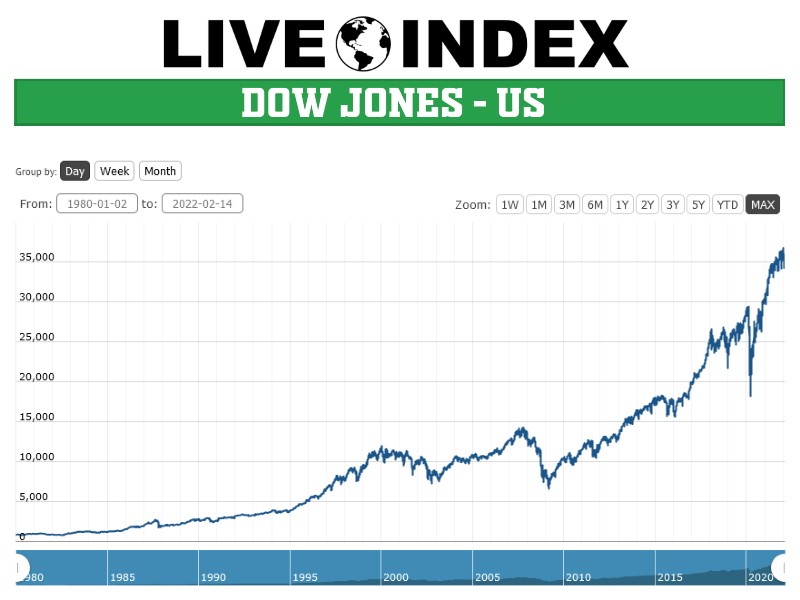
For long-term investors, the Dow’s daily fluctuations are often considered noise; the focus is on the overall trend and historical growth. Over decades, the Dow has consistently trended upward, reflecting the enduring growth of American corporations. Short-term traders, however, might attempt to capitalize on daily swings, using real-time data and technical analysis to make rapid buy and sell decisions. This approach carries significantly higher risk and requires constant monitoring and a deep understanding of market mechanics.
Diversification Beyond a Single Index
While the Dow is a valuable indicator, it only represents 30 companies, making it less diversified than broader indices like the S&P 500 or a total market fund. Prudent personal finance strategy emphasizes diversification across different asset classes (stocks, bonds, real estate), geographies, and market capitalizations. Relying solely on the Dow for investment exposure can limit diversification and expose an investor to concentrated risk, especially given its price-weighted nature.

The Importance of Professional Financial Advice
Navigating the complexities of the stock market, including understanding indices like the Dow, is a nuanced endeavor. For many, seeking guidance from a qualified financial advisor is invaluable. A professional can help you understand how market movements impact your specific financial goals, assist in crafting a diversified portfolio, and provide tailored advice based on your risk tolerance and investment horizon. They can help you contextualize the Dow’s current value within your broader financial plan, ensuring that your decisions are informed and strategic.
The question “what is the Dow Jones currently at?” opens a window into the intricate world of finance. It’s a query that demands not just a number, but context, understanding, and an appreciation for the forces that shape economic realities. By understanding its history, composition, influences, and how to access its data, investors can move beyond a mere headline figure to make more informed decisions, navigate market dynamics, and build robust financial futures. While the number itself is constantly changing, the knowledge of what it represents remains a stable foundation for financial literacy.
aViewFromTheCave is a participant in the Amazon Services LLC Associates Program, an affiliate advertising program designed to provide a means for sites to earn advertising fees by advertising and linking to Amazon.com. Amazon, the Amazon logo, AmazonSupply, and the AmazonSupply logo are trademarks of Amazon.com, Inc. or its affiliates. As an Amazon Associate we earn affiliate commissions from qualifying purchases.