The financial world often revolves around a simple, yet profoundly impactful, question: “What did the S&P 500 do today?” This seemingly straightforward inquiry unlocks a wealth of information about the health of the U.S. economy, the performance of its largest corporations, and the prevailing sentiment among investors. The S&P 500, a stock market index that represents 500 of the largest U.S. publicly traded companies, is not just a collection of numbers; it’s a dynamic barometer, pulsating with the collective hopes, fears, and analyses of millions of market participants. For both seasoned financial professionals and individual investors, understanding its daily movements is a crucial step toward making informed decisions in an ever-evolving market landscape.
Today’s performance of the S&P 500, whether it concluded with a gain, a loss, or a flat trajectory, is the culmination of countless factors ranging from corporate earnings reports and economic data to geopolitical events and shifts in investor psychology. It provides an immediate snapshot of where the market stands, influencing everything from retirement savings and investment strategies to business confidence and consumer spending. Diving deeper into “what the S&P did today” means dissecting these underlying forces, appreciating the interplay of macro and micro influences, and recognizing the short-term noise versus the long-term signals. This article aims to demystify the daily movements of this pivotal index, offering insights into its significance, the drivers behind its fluctuations, and how investors can interpret this critical information effectively.
Decoding the S&P 500: A Barometer of Economic Health
The S&P 500 stands as arguably the most important benchmark for the U.S. equity market, far more than just a ticker symbol on a screen. Its daily activity is watched globally because it offers a robust, real-time indication of the broader economic climate.
The Anatomy of the Index
At its core, the S&P 500 is a market-capitalization-weighted index. This means that companies with larger market values have a greater impact on the index’s overall performance. Comprising 500 leading U.S. companies across diverse sectors—from technology giants and financial institutions to healthcare providers and consumer staples—it offers a comprehensive snapshot of corporate America’s prowess and challenges. Unlike the Dow Jones Industrial Average, which is price-weighted and contains only 30 companies, the S&P 500’s broader composition and weighting methodology make it a more accurate and representative gauge of the large-cap U.S. equity market. When we ask “what did the S&P 500 do today,” we are essentially inquiring about the aggregate performance of these 500 economic powerhouses, reflecting a significant portion of the nation’s economic output and investor confidence.
Why “Today’s” Movement Matters
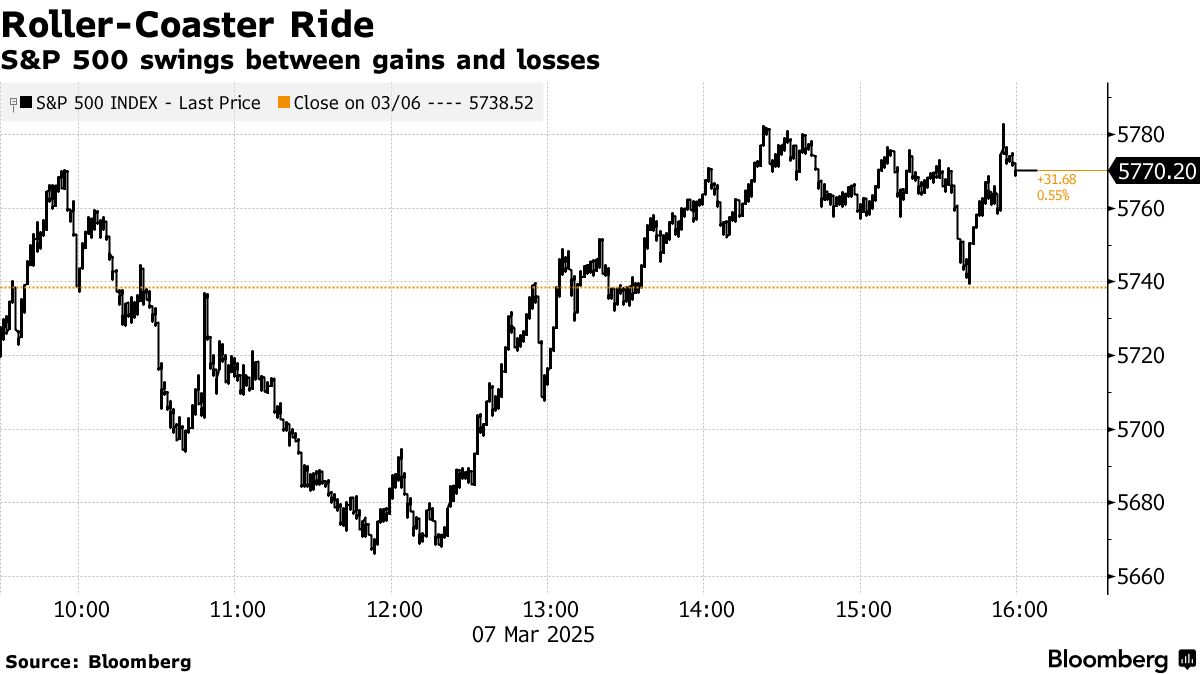
Every trading day, the S&P 500’s movement—whether it’s up by 1%, down by 0.5%, or relatively flat—sends ripples through financial markets. For many, it’s the first data point they check, acting as a quick pulse check on their investment portfolios and the economy. A significant upward move often signals optimism, perhaps fueled by strong economic data, positive corporate earnings, or a reduction in market uncertainty. Conversely, a noticeable dip can reflect rising concerns, such as inflation fears, weak economic indicators, or geopolitical tensions. These daily fluctuations are not merely numbers; they encapsulate the collective investor sentiment, reflecting how market participants are pricing in new information and adjusting their expectations for future growth and profitability. They inform trading decisions, influence capital allocation, and provide context for market commentators and economic analysts alike.
Beyond the Headline Number
While the daily percentage change of the S&P 500 is the headline, it’s crucial to look beyond this single figure. A modest gain or loss might mask significant movements within individual sectors or specific companies. For instance, a strong performance in the technology sector might offset weakness in energy, leading to a relatively flat overall index reading. Understanding these underlying dynamics—which sectors are leading or lagging, and which companies are significantly influencing the index—provides a much richer and more nuanced understanding of the day’s market activity. This granular view allows investors to assess if a broad-based rally or sell-off is occurring, or if the movement is concentrated in specific areas, which can have different implications for diversified portfolios.
Key Drivers Behind Daily S&P 500 Movements
The S&P 500’s daily gyrations are rarely arbitrary. They are the intricate dance of myriad forces, both domestic and global, micro and macro, tangible and psychological. Understanding these drivers is essential for deciphering the market’s language.
Corporate Earnings and Guidance
Perhaps the most direct catalyst for daily stock movements, and consequently the index, is corporate earnings. During earnings season, hundreds of S&P 500 companies report their quarterly financial results. Strong earnings beats, coupled with optimistic future guidance, can send individual stock prices soaring and buoy the entire index. Conversely, earnings misses, or a cautious outlook, can trigger sell-offs. The aggregate performance of these companies directly impacts the S&P 500, as the index is a reflection of their collective market value. Investors meticulously analyze these reports not just for past performance but for clues about future growth and profitability, which dictates investment appetite.
Macroeconomic Indicators
The broader economic environment plays a profound role. Data releases such as inflation rates (CPI, PPI), interest rate decisions by the Federal Reserve, GDP growth figures, employment reports (non-farm payrolls, unemployment rate), and consumer confidence indices provide critical insights into the economy’s trajectory. Positive economic news, indicating growth and stability, generally supports higher stock prices. Conversely, signs of inflation, rising interest rates, or an economic slowdown can spark fears of reduced corporate profits and lead to market pullbacks. Each piece of economic data is carefully scrutinized for its potential impact on corporate earnings, consumer spending, and the overall cost of capital.
Geopolitical Events and Global News
The S&P 500, while U.S.-focused, is not immune to global events. International conflicts, trade disputes, shifts in foreign policy, or major economic developments in other large economies (e.g., China, Europe) can create significant uncertainty and influence market sentiment. For instance, disruptions to global supply chains, energy price spikes due to geopolitical tensions, or new tariffs can impact the profitability of multinational S&P 500 companies, leading to widespread market reactions. In an interconnected world, a crisis in one region can quickly cascade into global financial markets, affecting investor risk appetite even far removed from the event itself.
Investor Sentiment and Market Psychology
Beyond fundamental data, human psychology is a potent force. Fear and greed often drive market behavior, leading to overreactions to news or speculative trading. Herd mentality can amplify trends, creating momentum-driven rallies or panic-fueled sell-offs. Technical analysis, which studies past market data, primarily price and volume, to identify patterns and predict future price movements, also plays a role as traders execute strategies based on these indicators. Sudden shifts in sentiment, often triggered by breaking news or simply a collective re-evaluation of risk, can generate significant intraday volatility and influence the S&P 500’s daily closing position.
Sectoral Performance
While the S&P 500 is a single index, it is composed of 11 distinct sectors (e.g., Technology, Healthcare, Financials, Energy, Industrials). On any given day, certain sectors may outperform or underperform significantly. For example, rising oil prices might boost energy stocks, while concerns over regulatory changes could weigh on financials. These sectoral rotations can have a substantial impact on the index’s overall daily movement. Analyzing which sectors are leading or lagging can offer deeper insights into the market’s underlying trends and provide clues about where capital is flowing, reflecting shifts in economic outlook or investor preferences.
Interpreting “Today’s” S&P 500 Performance for Informed Decisions
A single day’s movement of the S&P 500, while attention-grabbing, rarely tells the whole story. Astute investors understand the importance of context and a multi-faceted approach to interpretation.
Short-Term Volatility vs. Long-Term Trends
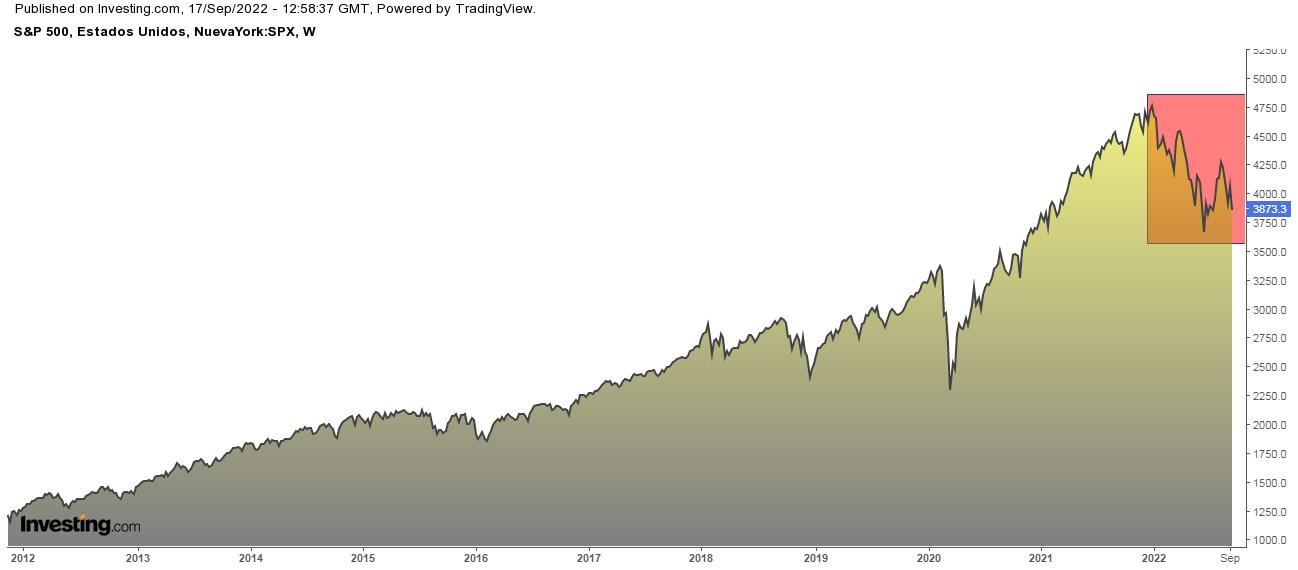
One of the most critical distinctions to make is between short-term volatility and long-term trends. The S&P 500 experiences daily fluctuations—ups and downs that can be quite dramatic—but these often represent mere noise within a broader, more enduring trend. A 1% dip today might feel significant, but in the context of a multi-year bull market, it could be an insignificant blip. Conversely, a strong rally might be an outlier in a longer bear market. Successful investing often hinges on maintaining a long-term perspective, understanding that markets are prone to daily oscillations but tend to trend upwards over decades, reflecting economic growth and innovation. Overreacting to daily news can lead to poor, emotionally driven decisions that undermine long-term financial goals.
The Role of Volume and Breadth
When assessing “what the S&P 500 did today,” it’s not just about the magnitude of the move but also the conviction behind it. Trading volume—the number of shares traded—provides insight into this conviction. A strong rally on high volume suggests broad participation and conviction, while a similar rally on low volume might indicate a lack of widespread support. Similarly, market breadth, which looks at the number of advancing stocks versus declining stocks, offers another layer of insight. If the S&P 500 closes higher, but the majority of individual stocks within the index actually declined, it suggests that the gains were concentrated in a few large-cap companies, potentially indicating underlying weakness rather than a broad-based rally.
Comparing Against Other Benchmarks
To gain a comprehensive understanding, it’s valuable to compare the S&P 500’s performance with other major indices. The Dow Jones Industrial Average (DJIA), representing 30 large-cap blue-chip companies, and the Nasdaq Composite, heavily weighted towards technology and growth stocks, offer different perspectives. The Russell 2000, which tracks small-cap companies, can indicate the health of smaller businesses and a broader risk appetite. If the S&P 500 is up, but the Russell 2000 is down, it could signal a flight to quality or concerns about smaller companies. Such comparisons provide a more holistic view of market dynamics and investor sentiment across different segments of the economy.
Impact on Personal Portfolios
Ultimately, the S&P 500’s daily movement has a direct bearing on many personal investment portfolios. If your portfolio includes S&P 500 index funds, ETFs, or a diversified mix of large-cap U.S. stocks, its performance directly correlates with your own investment returns. While individual stock selections can deviate, the overall market trend, largely dictated by the S&P 500, sets the stage. Understanding its daily shifts helps investors gauge the general direction of their holdings and can inform decisions regarding rebalancing, asset allocation, or simply offer peace of mind during periods of volatility, knowing that market corrections are a normal part of the long-term investment cycle.
Tools and Resources for Tracking S&P 500 Daily Performance
In today’s digital age, a wealth of resources are available to track the S&P 500’s daily performance, offering varying levels of detail and analysis.
Financial News Outlets
Major financial news outlets like The Wall Street Journal, Bloomberg, Reuters, CNBC, and Fox Business provide real-time updates, breaking news, expert commentary, and in-depth analysis of the S&P 500’s movements throughout the trading day. These sources often feature market recaps at the end of the day, explaining the key drivers behind the performance. They are invaluable for understanding the qualitative story behind the numbers.
Online Brokerage Platforms
Most online brokerage platforms (e.g., Fidelity, Schwab, E*TRADE, Vanguard) offer robust tools for tracking the S&P 500. These often include real-time quotes, interactive charts, historical data, news feeds, and even proprietary research reports that analyze market trends and index performance. For investors with active accounts, these platforms serve as a centralized hub for monitoring their investments and the broader market.
Financial Data Websites and Apps
Numerous websites and mobile applications specialize in financial data. Platforms like Yahoo Finance, Google Finance, Investing.com, and MarketWatch offer free access to S&P 500 data, including intraday charts, historical performance, and related news. For more sophisticated analysis, subscription services like Bloomberg Terminal or Refinitiv Eikon provide institutional-grade data, analytics, and news feeds that offer unparalleled depth. These tools enable investors to track the index from anywhere, often with customizable alerts and watchlists.
Economic Calendars
To anticipate potential market-moving events, economic calendars are indispensable. Websites like ForexFactory, Investing.com, or Bloomberg provide detailed schedules of upcoming economic data releases (e.g., jobs reports, inflation data, central bank meetings). By knowing when these announcements are slated, investors can brace for potential volatility and understand the context behind daily S&P 500 swings. Staying ahead of the news flow, rather than reacting to it, is a hallmark of informed investing.
Strategic Implications for Investors
Understanding “what the S&P 500 did today” is not merely an exercise in observation; it carries significant strategic implications for how investors manage their portfolios and approach the market.
The Importance of Diversification
Regardless of the S&P 500’s daily performance, the fundamental principle of diversification remains paramount. While the index offers broad exposure to large-cap U.S. equities, a well-diversified portfolio extends beyond this, potentially including international stocks, bonds, real estate, and other asset classes. Diversification helps mitigate risk by ensuring that no single asset class or region dictates the entire portfolio’s performance, thereby cushioning the impact of any single day’s S&P 500 movement. When the S&P 500 has a bad day, a diversified portfolio might experience a lesser decline due to the performance of uncorrelated assets.
Long-Term Perspective
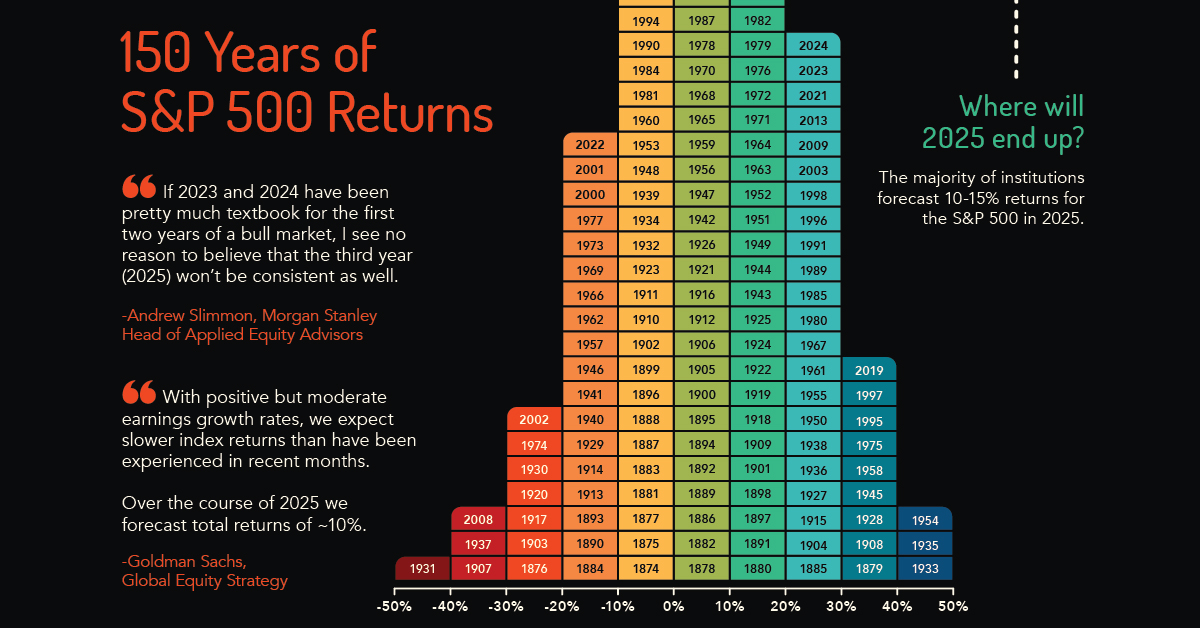
Perhaps the most crucial strategic implication is the reinforcement of a long-term investment horizon. While daily S&P 500 movements generate headlines, successful wealth creation typically occurs over years and decades, not days. Trying to time the market by reacting to every daily fluctuation is notoriously difficult and often leads to sub-optimal returns due to transaction costs and missed opportunities. A disciplined approach, such as dollar-cost averaging (investing a fixed amount regularly), and a focus on long-term growth objectives help insulate investors from the emotional rollercoaster of daily market noise. History shows that despite numerous corrections and bear markets, the S&P 500 has consistently delivered positive returns over extended periods.
Rebalancing and Risk Management
Daily S&P 500 performance can subtly shift portfolio allocations. For instance, a prolonged period of strong S&P 500 gains might cause the equity portion of a portfolio to grow beyond its target allocation, increasing overall risk. Conversely, a significant market downturn might underweight equities. Regularly rebalancing the portfolio—selling appreciated assets to buy underperforming ones—ensures that it remains aligned with the investor’s desired risk tolerance and asset allocation strategy. This is a proactive form of risk management that uses market movements as an impetus to adjust, rather than simply react.
Staying Informed, Not Obsessed
Finally, while staying informed about the S&P 500’s daily movements is vital, it’s equally important not to become overly obsessed. Constant monitoring can lead to emotional decision-making, anxiety, and an unhealthy focus on short-term gains or losses. The strategic implication is to strike a balance: be aware of significant market trends and economic developments, but avoid the temptation to make impulsive trades based on daily headlines. A calm, rational, and well-researched approach, grounded in a solid investment plan, will consistently outperform a strategy driven by the ebb and flow of daily market sentiment.
In conclusion, the question “what did the S&P 500 do today?” is far more than a simple query about numbers. It’s an entry point into understanding the intricate dynamics of the global financial markets, the health of the U.S. economy, and the collective sentiment of investors worldwide. By delving into the drivers behind its daily performance and interpreting these movements with a strategic, long-term perspective, investors can navigate the complexities of the market with greater confidence and make more informed decisions toward achieving their financial aspirations. The S&P 500 remains a cornerstone of financial understanding, offering daily lessons for those willing to look beyond the surface.
aViewFromTheCave is a participant in the Amazon Services LLC Associates Program, an affiliate advertising program designed to provide a means for sites to earn advertising fees by advertising and linking to Amazon.com. Amazon, the Amazon logo, AmazonSupply, and the AmazonSupply logo are trademarks of Amazon.com, Inc. or its affiliates. As an Amazon Associate we earn affiliate commissions from qualifying purchases.