
The S&P 500 is more than just a ticker symbol; it’s a critical barometer of the U.S. economy and a cornerstone for countless investment portfolios worldwide. Representing 500 of the largest publicly traded companies in the United States, its daily movements offer a snapshot of market sentiment, corporate health, and broader economic trends. For investors, financial professionals, and even casual observers, understanding what the S&P 500 is doing today provides vital insights into the forces shaping global finance. Its performance can influence everything from retirement savings to consumer confidence, making its daily pulse a subject of constant scrutiny and analysis.
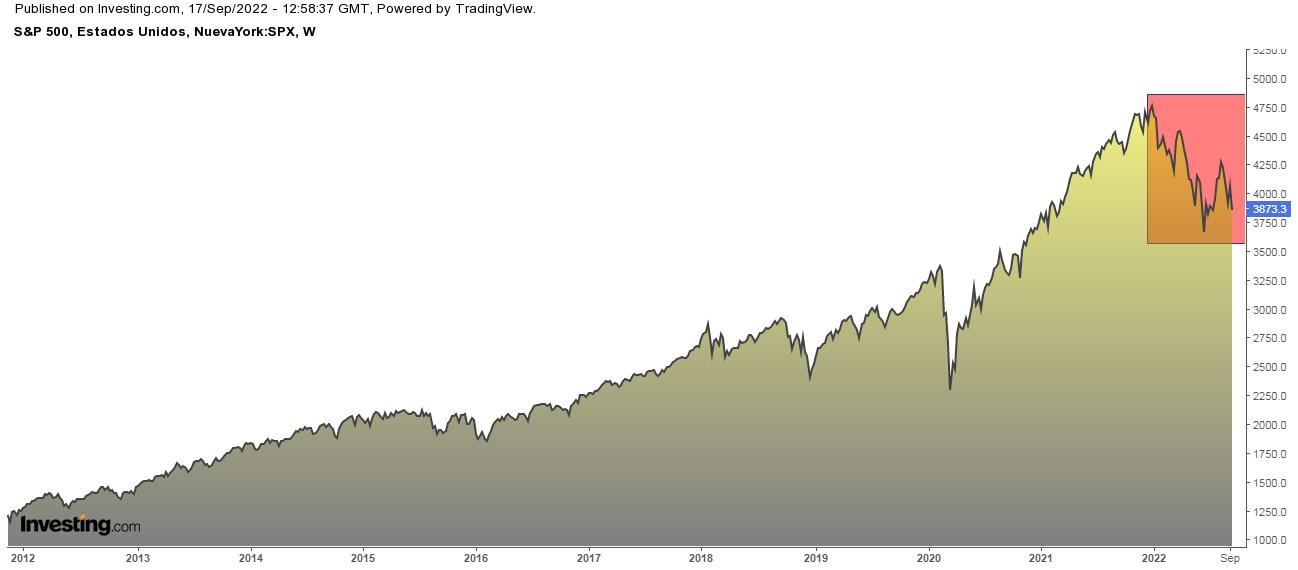
Today, like any other trading day, the S&P 500 is a dynamic reflection of a multitude of inputs—from company-specific earnings reports and macroeconomic data releases to geopolitical developments and shifts in investor psychology. Pinpointing its exact trajectory requires a look beyond the headlines, delving into the underlying drivers that propel its ascent or contribute to its decline. Whether it’s trending upwards, signaling optimism and growth, or facing headwinds, indicating caution or potential contraction, each movement carries implications for those navigating the intricate world of money and investments.
Decoding the S&P 500’s Daily Pulse
To truly grasp “what the S&P 500 is doing today,” one must first understand what the index represents and how its daily fluctuations are measured and interpreted. It’s not a single entity but a weighted average of 500 diverse companies, making its movements a sophisticated indicator of the broader market’s health.
What the S&P 500 Represents
The S&P 500, or Standard & Poor’s 500, is a stock market index that tracks the performance of 500 large companies listed on U.S. stock exchanges. Managed by S&P Dow Jones Indices, it is a market-capitalization-weighted index, meaning companies with larger market values have a greater impact on the index’s overall performance. This composition makes it an excellent proxy for the health of the U.S. stock market and, by extension, the U.S. economy. Its constituent companies span eleven major sectors, including Technology, Healthcare, Financials, Consumer Discretionary, and Industrials, ensuring a broad representation of the economic landscape. For many investors, especially those employing passive strategies, the S&P 500 serves as the primary benchmark against which their portfolio performance is measured. Its inclusion criteria are stringent, requiring profitability, sufficient liquidity, and public float, among other factors, ensuring that only robust and influential companies make the cut.
How Daily Changes Are Measured
The daily change in the S&P 500 is typically expressed in “points” and “percentage points.” A movement of, say, 50 points might sound significant, but its actual impact is better understood when converted to a percentage change. For instance, if the index is at 5,000 points, a 50-point move represents a 1% change, whereas if it were at 2,500 points, it would be a 2% change. These percentage changes are crucial for comparing performance across different periods or against other indices. The market-cap weighting means that a significant movement in a heavily weighted stock, such as Apple or Microsoft, can have a disproportionately larger impact on the overall index than a similar percentage move in a smaller constituent company. Financial news outlets constantly update these figures throughout the trading day, providing real-time data on the opening price, intraday highs and lows, and the current trading level relative to the previous day’s close.
The Significance of Intraday vs. Closing Performance
When we ask “what is the S&P 500 doing today,” we often refer to its current intraday movement. However, the closing performance—the price at which the index settles at the end of the trading day—is what truly matters for official records and historical analysis. Intraday fluctuations can be volatile, driven by breaking news, algorithmic trading, or shifting sentiment. A sharp morning decline might be fully recovered by market close, or vice versa. Experienced investors typically pay attention to the closing price as it reflects the cumulative effect of all trading activity and sentiment over a full session. While intraday movements can offer clues about immediate market dynamics and potential reversals, long-term investment decisions are rarely based on these fleeting trends. The close-to-close comparison provides a more stable and reliable measure of daily performance, stripping away the minute-by-minute noise.
The Forces Shaping Today’s Market Action
The S&P 500’s daily trajectory is rarely arbitrary. It is the complex result of a confluence of macroeconomic indicators, corporate announcements, global events, and the often-unpredictable tides of investor sentiment. Understanding these forces is key to interpreting today’s performance and anticipating future movements.
Economic Indicators and Their Impact
Economic data releases are paramount in influencing the S&P 500. Reports on inflation (like the Consumer Price Index), employment (Non-Farm Payrolls, unemployment rates), Gross Domestic Product (GDP), and consumer confidence can drastically shift market expectations regarding interest rates and corporate profitability. For example, higher-than-expected inflation figures might signal that the Federal Reserve will maintain or increase interest rates, potentially dampening corporate earnings and stock valuations. Conversely, strong jobs reports or robust GDP growth can ignite investor optimism, suggesting a healthy economy capable of supporting higher stock prices. Today’s market reaction to such reports is often immediate and pronounced, as algorithms and human traders alike adjust positions based on the latest economic outlook.
Corporate Earnings and Sector Performance
Beneath the overall S&P 500 index lie the individual performances of its 500 companies. Quarterly earnings reports are crucial catalysts, often causing significant price swings in individual stocks that can then ripple through the entire index, especially for highly weighted components. When several major companies within a key sector—say, technology or financials—report strong earnings and positive outlooks, it can provide significant upward momentum for the S&P 500. Conversely, a spate of disappointing results can drag the index down. Beyond individual reports, broader sector trends are also vital. For instance, if the energy sector is performing strongly due to rising oil prices, or if the healthcare sector is seeing innovation-driven growth, these positive trends can contribute substantially to the S&P 500’s overall daily gain.
Geopolitical Developments and Global Events
The S&P 500, while primarily a U.S. index, does not exist in a vacuum. Geopolitical events, such as international conflicts, trade disputes, or significant political shifts in major global economies, can introduce uncertainty and volatility into the market. A sudden escalation in geopolitical tensions could lead to a broad sell-off as investors seek safer assets, while the resolution of a trade dispute might spark a rally. Even events like natural disasters in key industrial regions can disrupt supply chains and impact the profitability of multinational corporations, thereby affecting the index. Today’s market participants are highly attuned to global headlines, often reacting swiftly to developments that could alter the economic landscape or corporate operating environments.

Investor Sentiment and Market Psychology
Perhaps one of the most elusive yet powerful drivers of market action is investor sentiment. This refers to the overall attitude of investors toward a particular market or asset. When sentiment is bullish, driven by optimism and a “fear of missing out” (FOMO), investors are more likely to buy, pushing prices higher. Conversely, bearish sentiment, fueled by fear and uncertainty, can lead to selling and market declines. This psychological aspect can sometimes override fundamental economic data, creating irrational exuberance or undue pessimism. Factors like social media trends, popular financial narratives, and even the general mood of the news cycle can contribute to shifts in sentiment, making it a critical, albeit intangible, force influencing “what the S&P 500 is doing today.”
Navigating S&P 500 Data for Personal Finance and Investing
For individual investors and those managing personal finances, simply knowing whether the S&P 500 is up or down today is just the beginning. The true value lies in interpreting this data within a broader financial strategy, avoiding common pitfalls, and leveraging available tools.
Beyond the Headlines: Digging Deeper into the Numbers
A cursory glance at the S&P 500’s daily change tells only part of the story. A more insightful approach involves understanding why it moved. Was the movement broad-based across all sectors, or was it concentrated in a few heavily weighted areas? For example, if the index gained 1% but that gain was primarily driven by a surge in a handful of mega-cap tech stocks, it might indicate a narrower market rally rather than widespread economic strength. Conversely, if a dip is mainly due to a single sector facing unique challenges (e.g., energy prices affecting airlines), it may not reflect a systemic issue. Astute investors look at sector performance, individual stock contributions, and the volume of trading activity to gain a more nuanced understanding of the day’s events. This deeper dive helps in assessing the underlying health of the market and making informed decisions about one’s own portfolio allocation.
Long-Term Perspective vs. Short-Term Noise
One of the most crucial lessons for any investor is to differentiate between short-term market noise and long-term trends. Daily fluctuations in the S&P 500, while newsworthy, are often just that—noise. Over the past several decades, the S&P 500 has demonstrated a consistent upward trend, despite numerous corrections, bear markets, and economic downturns. Reacting emotionally to every daily dip or rally can lead to impulsive decisions, such as selling during a downturn (locking in losses) or buying at a peak (setting oneself up for a correction). A disciplined approach, rooted in a long-term investment horizon, encourages investors to focus on their financial goals, maintain a diversified portfolio, and resist the urge to trade frequently based on daily market movements. For most, dollar-cost averaging into an S&P 500 index fund or ETF is a robust strategy that mitigates the impact of daily volatility.
Diversification and Risk Management
Understanding the S&P 500’s daily performance also highlights the importance of diversification. While the S&P 500 itself offers some level of diversification across 500 companies, a truly diversified portfolio extends beyond this single index. It might include international stocks, bonds, real estate, or alternative assets, each with different risk profiles and correlations to the S&P 500. If the S&P 500 is having a challenging day, a diversified portfolio might be buffered by the performance of other asset classes. Risk management involves not only diversification but also aligning investments with one’s personal risk tolerance, financial goals, and time horizon. Observing daily S&P 500 movements can serve as a periodic reminder to re-evaluate one’s overall asset allocation and ensure it remains aligned with these personal financial parameters.
Utilizing Financial Tools and Platforms
Today’s investors have access to an unprecedented array of financial tools and platforms to monitor the S&P 500 and their investments. From brokerage apps offering real-time data and customizable watchlists to sophisticated analytical software providing charting tools and economic calendars, these resources empower individuals to stay informed. Platforms like Yahoo Finance, Google Finance, Bloomberg, and various investing apps provide not only the current S&P 500 value but also historical data, analyst reports, news feeds, and the performance of individual constituent companies. Learning to effectively use these tools can help investors track their portfolios, research potential investments, and gain a clearer picture of market dynamics, all without the need for an expensive financial advisor, though professional advice remains invaluable for complex financial planning.
The S&P 500’s Role in the Broader Economic Narrative
The S&P 500’s daily performance is more than just a score for investors; it’s a vital component of the broader economic narrative, offering insights into the health of the U.S. economy and hinting at future trends.
A Barometer of Economic Health
Often referred to as a leading economic indicator, the S&P 500 can serve as a potent barometer for the overall health of the U.S. economy. When the index is consistently rising, it generally reflects investor confidence in corporate profitability, economic growth, and future prospects. This positive sentiment can translate into increased consumer spending, business investment, and job creation. Conversely, a sustained decline in the S&P 500 can signal underlying economic weaknesses, such as impending recessions, declining corporate earnings, or reduced consumer confidence. While not a perfect predictor, its movements are closely watched by economists, policymakers, and central bankers, who often factor market performance into their economic assessments and policy decisions.
Connecting Today’s Performance to Future Trends
Today’s S&P 500 movements, when viewed in context, can offer clues about potential future economic and market trends. For example, if specific sectors within the S&P 500 are consistently outperforming or underperforming, it might suggest evolving industry landscapes or shifts in consumer behavior. A strong rally in cyclical sectors (like industrials or consumer discretionary) might indicate an expectation of robust economic expansion, while a flight to defensive sectors (like utilities or staples) could signal economic apprehension. Furthermore, the S&P 500’s reaction to interest rate expectations, inflation data, or technological breakthroughs can foreshadow changes in various asset classes, from bond yields to commodity prices, guiding investors in adjusting their long-term strategies.

The Influence of Monetary Policy
The actions of the Federal Reserve and its monetary policy decisions are perhaps one of the most significant external forces influencing the S&P 500. Interest rate changes, quantitative easing or tightening, and forward guidance on economic outlooks can directly impact corporate borrowing costs, consumer spending, and the attractiveness of equity investments versus bonds. When the Fed signals a dovish stance (lower rates, more liquidity), it generally creates a more favorable environment for stocks, as borrowing is cheaper and economic growth is encouraged. Conversely, hawkish policies (higher rates, reduced liquidity) can make stocks less attractive and increase the cost of capital for businesses, potentially leading to market corrections. Today’s S&P 500 performance is almost always implicitly (or explicitly) reacting to the current and anticipated direction of monetary policy.
In conclusion, “what the S&P 500 is doing today” is far more than a simple numerical change. It’s a complex interplay of economic fundamentals, corporate performance, geopolitical shifts, and human psychology, all filtered through the lens of a highly efficient, yet often volatile, financial market. For anyone engaged in personal finance or investing, developing an informed perspective on these daily movements, while maintaining a focus on long-term goals and diversified strategies, is paramount to financial success.
aViewFromTheCave is a participant in the Amazon Services LLC Associates Program, an affiliate advertising program designed to provide a means for sites to earn advertising fees by advertising and linking to Amazon.com. Amazon, the Amazon logo, AmazonSupply, and the AmazonSupply logo are trademarks of Amazon.com, Inc. or its affiliates. As an Amazon Associate we earn affiliate commissions from qualifying purchases.