Inflation is one of the most persistent and impactful economic phenomena, silently eroding the purchasing power of money over time. Understanding how to calculate its rate is not merely an academic exercise; it’s a vital skill for anyone managing personal finances, making investment decisions, or running a business. By quantifying inflation, individuals and organizations can make informed choices, protect their assets, and plan for a financially stable future. This guide will demystify the process, offering a clear, step-by-step approach to calculating the rate of inflation and explaining why this metric is indispensable for sound financial planning.
Understanding Inflation: More Than Just Rising Prices
Before diving into calculations, it’s crucial to grasp what inflation truly represents and why it holds such significance in the economic landscape. It’s more complex than a simple price hike on your favourite coffee; it’s a systemic economic force.
Defining Inflation and Its Economic Impact
At its core, inflation is the rate at which the general level of prices for goods and services is rising, and consequently, the purchasing power of currency is falling. When inflation is high, a unit of currency buys less than it did before. This erosion of purchasing power impacts everything from the cost of groceries to the value of savings.
Economically, moderate inflation is often seen as a sign of a healthy, growing economy. It encourages spending and investment, as money is worth slightly less in the future. However, high or hyperinflation can destabilize economies, leading to uncertainty, reduced investment, and social unrest. Deflation, on the other hand (a general decrease in prices), can also be problematic, signaling weak demand and potentially leading to economic stagnation. Understanding the specific rate allows policymakers to adjust monetary policy, businesses to set prices, and consumers to plan their budgets effectively.
Key Measures of Inflation
Governments and economists employ various indices to track inflation, each serving a slightly different purpose or focusing on different sectors of the economy. The most prominent of these include:
- Consumer Price Index (CPI): This is the most widely recognized and frequently cited measure of inflation. The CPI tracks the average change over time in the prices paid by urban consumers for a market basket of consumer goods and services, including food, housing, apparel, transportation, medical care, education, and communication. It’s the primary tool for understanding the impact of inflation on households.
- Producer Price Index (PPI): The PPI measures the average change over time in the selling prices received by domestic producers for their output. It focuses on prices at the wholesale level, capturing inflation earlier in the production chain. Changes in PPI can often be a leading indicator for future changes in CPI.
- Personal Consumption Expenditures (PCE) Index: This index measures price changes for all goods and services purchased by consumers and is preferred by the U.S. Federal Reserve for its broader coverage and ability to account for changes in consumer spending habits more effectively than CPI. For example, if the price of beef rises sharply, PCE will reflect consumers shifting to chicken more readily.
While all these indices are valuable, for the purpose of understanding how inflation impacts an average household’s budget and general cost of living, the CPI is typically the go-to metric.
The Mechanics of Inflation Calculation: Step-by-Step
Calculating the rate of inflation, particularly using the CPI, follows a straightforward formula once you have the necessary data. It fundamentally measures the percentage change in prices between two periods.
Gathering the Right Data: The Role of Price Indices
The foundation of any inflation calculation is reliable price data, usually in the form of a price index. The CPI, for instance, is not a simple average of all prices but a weighted average. Government statistical agencies (like the Bureau of Labor Statistics (BLS) in the U.S., Eurostat in the EU, or the Office for National Statistics (ONS) in the UK) survey thousands of households and businesses to compile a representative “basket” of goods and services that an average household consumes. Each item in the basket is weighted according to its importance in household spending.
To calculate inflation, you will need the CPI values for two different periods: a current period and a previous period. These values are typically published monthly and annually by national statistical offices. For example, if you want to calculate the annual inflation rate for 2023, you would need the CPI for December 2023 and the CPI for December 2022.
The Core Formula: Percentage Change
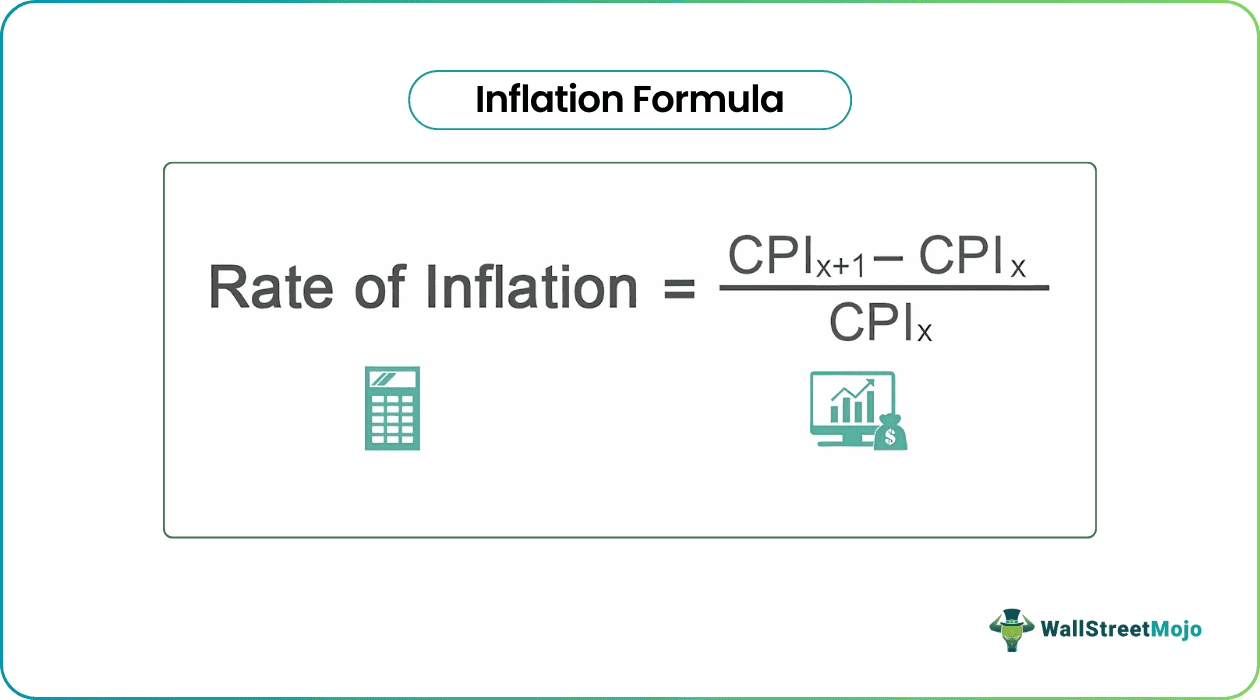
Once you have the relevant index values, calculating the inflation rate is a simple application of the percentage change formula. The formula for the inflation rate between two periods is:
$$ text{Inflation Rate} = left( frac{text{CPI}{text{Current Year}} – text{CPI}{text{Previous Year}}}{text{CPI}_{text{Previous Year}}} right) times 100 $$
Let’s illustrate with a hypothetical example:
- Suppose the CPI for December 2022 was 280.0
- Suppose the CPI for December 2023 was 290.0
Using the formula:
$$ text{Inflation Rate} = left( frac{290.0 – 280.0}{280.0} right) times 100 $$
$$ text{Inflation Rate} = left( frac{10.0}{280.0} right) times 100 $$
$$ text{Inflation Rate} approx 0.0357 times 100 $$
$$ text{Inflation Rate} approx 3.57% $$

This calculation indicates that prices, on average, rose by approximately 3.57% between December 2022 and December 2023.
Practical Considerations and Annualization
While the formula is straightforward, real-world application involves several practical considerations:
- Timeframes: Inflation can be calculated monthly, quarterly, or annually. The most common is the year-over-year (YoY) rate, which compares the current month’s CPI to the same month in the previous year. This approach smooths out seasonal fluctuations and provides a clearer picture of underlying trends. Month-over-month (MoM) rates show immediate changes but can be more volatile.
- Seasonality: Many prices are seasonal (e.g., fresh produce, holiday travel). Statistical agencies often publish both seasonally adjusted and unadjusted CPI data. Seasonally adjusted data attempts to remove these predictable fluctuations to reveal underlying inflationary trends.
- Core Inflation vs. Headline Inflation: Headline inflation, typically reported, includes all items in the CPI basket. Core inflation, however, excludes volatile items like food and energy prices. This provides a measure of inflation that is less influenced by short-term supply shocks and can give a better indication of long-term price trends and underlying economic pressures.
Beyond the Basics: Advanced Aspects and Nuances
While the core calculation is simple, understanding the nuances of how inflation is measured provides a deeper insight into its real impact and limitations.
Different Timeframes and Their Significance
The choice of timeframe for calculating inflation is critical and depends on the analysis being performed.
- Year-over-Year (YoY): This is the most frequently cited and generally preferred measure. Comparing the current month’s index to the same month in the prior year (e.g., April 2024 vs. April 2023) effectively eliminates seasonal patterns, offering a stable view of the annual inflation trend. It’s excellent for understanding long-term price movements and economic policy effectiveness.
- Month-over-Month (MoM): Comparing the current month’s index to the previous month (e.g., April 2024 vs. March 2024) provides an immediate snapshot of recent price changes. While more volatile, MoM data is useful for spotting rapid shifts in inflationary pressures and can be annualized to project potential annual rates if current trends persist.
- Annualized Rates: When looking at short-term data (e.g., a single quarter or a few months), economists often “annualize” the rate to project what the inflation rate would be if that trend continued for a full year. For example, if the MoM inflation is 0.2%, an annualized rate might be calculated as (1 + 0.002)^12 – 1, which provides a hypothetical full-year impact.
The Impact of Weighting and Substitution Bias
The accuracy and relevance of the CPI depend heavily on how its “basket” of goods and services is constructed and maintained.
- Weighting: Different categories of spending (e.g., housing, transportation, food) are assigned different weights in the CPI based on their proportion of average household expenditure. These weights are periodically updated, but they reflect past spending patterns. A significant shift in consumer behavior not yet captured by the weights can slightly distort the true impact of inflation.
- Substitution Bias: When the price of a specific good rises, consumers often substitute it with a cheaper alternative (e.g., buying chicken instead of beef). Traditional fixed-basket CPI measures might overestimate inflation because they assume consumers continue buying the more expensive item. More advanced indices (like the PCE) try to account for this substitution bias, often showing slightly lower inflation rates than CPI.
- Quality Adjustments: Goods and services evolve. A new smartphone might cost more than its predecessor, but it also offers significantly enhanced features. Statistical agencies attempt to make “quality adjustments” to price data, ensuring that price increases due to improved quality are not mistakenly counted as pure inflation.
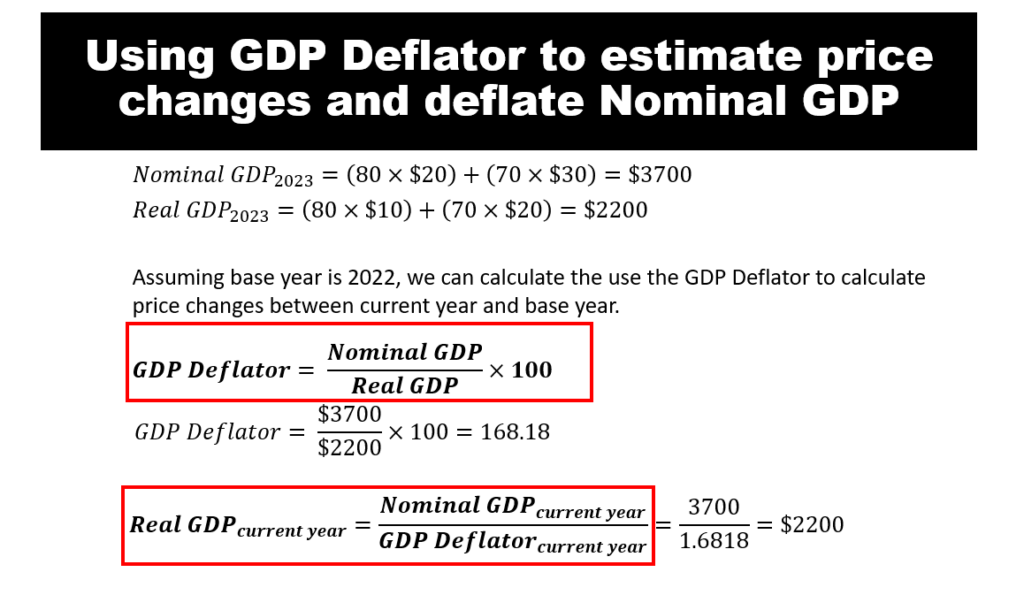
Real vs. Nominal Values: Adjusting for Inflation
One of the most crucial applications of inflation calculation is distinguishing between nominal and real values.
- Nominal Values: These are the stated values (e.g., your salary, investment returns) without any adjustment for inflation. If your salary increases by 5% but inflation is 7%, your nominal income has risen, but your real income has actually decreased.
- Real Values: These values are adjusted for inflation, reflecting true purchasing power. To calculate real returns or real income, you subtract the inflation rate from the nominal rate.
- Real Rate of Return ≈ Nominal Rate of Return – Inflation Rate
- For example, if your investment earned a nominal 8% return and inflation was 3%, your real return was approximately 5%. This calculation is fundamental for understanding your true wealth accumulation.
Why Calculating Inflation Matters for Your Money
The ability to calculate and understand inflation is not just an economist’s tool; it’s a fundamental aspect of sound financial literacy for individuals and strategic planning for businesses.
Personal Finance Implications
For individuals, inflation directly impacts their daily lives and long-term financial security.
- Budgeting and Cost of Living: Understanding the current inflation rate helps you anticipate future expenses. If inflation is 5%, you know your current budget will buy 5% less next year, prompting you to adjust spending or seek higher income. This is especially critical for fixed-income earners or retirees.
- Retirement Planning and Investments: Inflation is the silent killer of purchasing power. A retirement nest egg that seems substantial today might be inadequate in 20 or 30 years if inflation isn’t factored in. Investors must seek returns that not only beat inflation but also provide a real return to grow wealth. Understanding inflation helps you choose appropriate investment vehicles, such as inflation-protected securities or equities that tend to perform well during inflationary periods.
- Loan Interest Rates: Lenders account for expected inflation when setting interest rates. The nominal interest rate on a loan includes a component to compensate the lender for the erosion of their money’s value due to inflation. Borrowers need to understand the real interest rate they are paying, which is the nominal rate minus the inflation rate.
Business Strategy and Decision Making
Businesses rely heavily on inflation data to make strategic operational and financial decisions.
- Pricing Strategies: Companies must factor in rising input costs (raw materials, labor, energy) to set competitive prices that maintain profit margins. Calculating inflation on various cost components helps businesses anticipate future expenses and adjust pricing proactively.
- Wage Negotiations and Compensation Adjustments: To attract and retain talent, businesses often need to adjust wages to keep pace with the cost of living. Inflation data provides a critical benchmark for annual salary reviews and collective bargaining agreements, ensuring employees’ real wages do not decline.
- Investment Decisions and Capital Budgeting: When evaluating long-term projects or capital investments, businesses must discount future cash flows back to present value. The discount rate used needs to account for inflation to accurately reflect the real cost of capital and the real value of future earnings.
- Forecasting and Economic Outlook: Businesses use inflation forecasts, often derived from current and historical inflation rates, to predict future economic conditions, consumer demand, and market trends. This is vital for inventory management, production planning, and overall business strategy.
In conclusion, knowing how to calculate the rate of inflation, primarily through the Consumer Price Index, is an indispensable skill in today’s economic environment. It empowers individuals to safeguard their savings and make informed personal finance decisions, while enabling businesses to strategically navigate economic changes, maintain profitability, and foster sustainable growth. Far from being a niche economic concept, inflation calculation is a practical tool for financial empowerment.
aViewFromTheCave is a participant in the Amazon Services LLC Associates Program, an affiliate advertising program designed to provide a means for sites to earn advertising fees by advertising and linking to Amazon.com. Amazon, the Amazon logo, AmazonSupply, and the AmazonSupply logo are trademarks of Amazon.com, Inc. or its affiliates. As an Amazon Associate we earn affiliate commissions from qualifying purchases.