
In the dynamic world of finance, understanding change is paramount. Whether you’re tracking the performance of your investments, analyzing a business’s revenue, or monitoring economic indicators, the ability to accurately measure fluctuations is indispensable. Among these crucial metrics, percentage decline stands out as a vital tool for quantifying reductions, losses, or negative shifts. It provides a standardized way to compare these changes, regardless of the absolute values involved, offering clarity and perspective that raw numbers alone often obscure.
This comprehensive guide will demystify the process of calculating percentage decline, illustrating its critical importance across various financial contexts. We’ll break down the formula, walk through practical examples, explore its diverse applications, and discuss best practices for interpreting and utilizing this powerful financial metric to make more informed decisions.
Understanding the Fundamentals of Percentage Decline
Before diving into the calculations, it’s essential to grasp what percentage decline truly represents and why it holds such significance in financial analysis.
What is Percentage Decline?
Percentage decline, often referred to as percentage decrease, quantifies the relative reduction between an initial (or original) value and a subsequent (or new) value. It expresses this reduction as a proportion of the initial value, multiplied by 100 to convert it into a percentage. Essentially, it tells you “how much something went down” in relation to its starting point. This makes it a universal metric for comparing decreases across different scales. For instance, a 10% decline in a $100 stock is a $10 loss, while a 10% decline in a $1,000,000 business revenue is a $100,000 loss. The percentage allows for direct comparison of the rate of decline.
Why is it Crucial in Finance?
The importance of percentage decline in finance cannot be overstated. It serves as a cornerstone for:
- Assessing Losses and Risk: Investors use it to understand the magnitude of losses in their portfolios during market downturns or specific asset underperformance. Businesses apply it to quantify revenue shortfalls, profit reductions, or market share contraction.
- Performance Evaluation: It allows for standardized comparison of performance. If one investment drops by $50 and another by $500, simply comparing the dollar amounts doesn’t tell the whole story. If the first investment was worth $100 and the second $10,000, both represent a 50% decline, indicating a similar proportional impact.
- Benchmarking: Financial analysts use percentage declines to compare a company’s performance against industry benchmarks or competitors, identifying areas of weakness or underperformance.
- Trend Analysis: By tracking percentage declines over time, financial professionals can identify trends, forecast potential future issues, and understand cyclical patterns in markets or business operations.
- Budgeting and Cost Control: Individuals and businesses can use it to track deviations from budgets or reductions in spending, identifying areas where costs have been successfully cut or where overspending has occurred.
Key Components of the Calculation
To calculate percentage decline, you primarily need two pieces of information:
- Initial Value (or Original Value): This is the starting point, the value before any decrease occurred.
- Final Value (or New Value): This is the value after the decrease has taken place.
It’s critical that the initial value is always greater than the final value for a decline to have occurred. If the final value is greater, you would be calculating a percentage increase.
The Step-by-Step Calculation Process
Calculating percentage decline is straightforward once you understand the formula and apply it correctly.
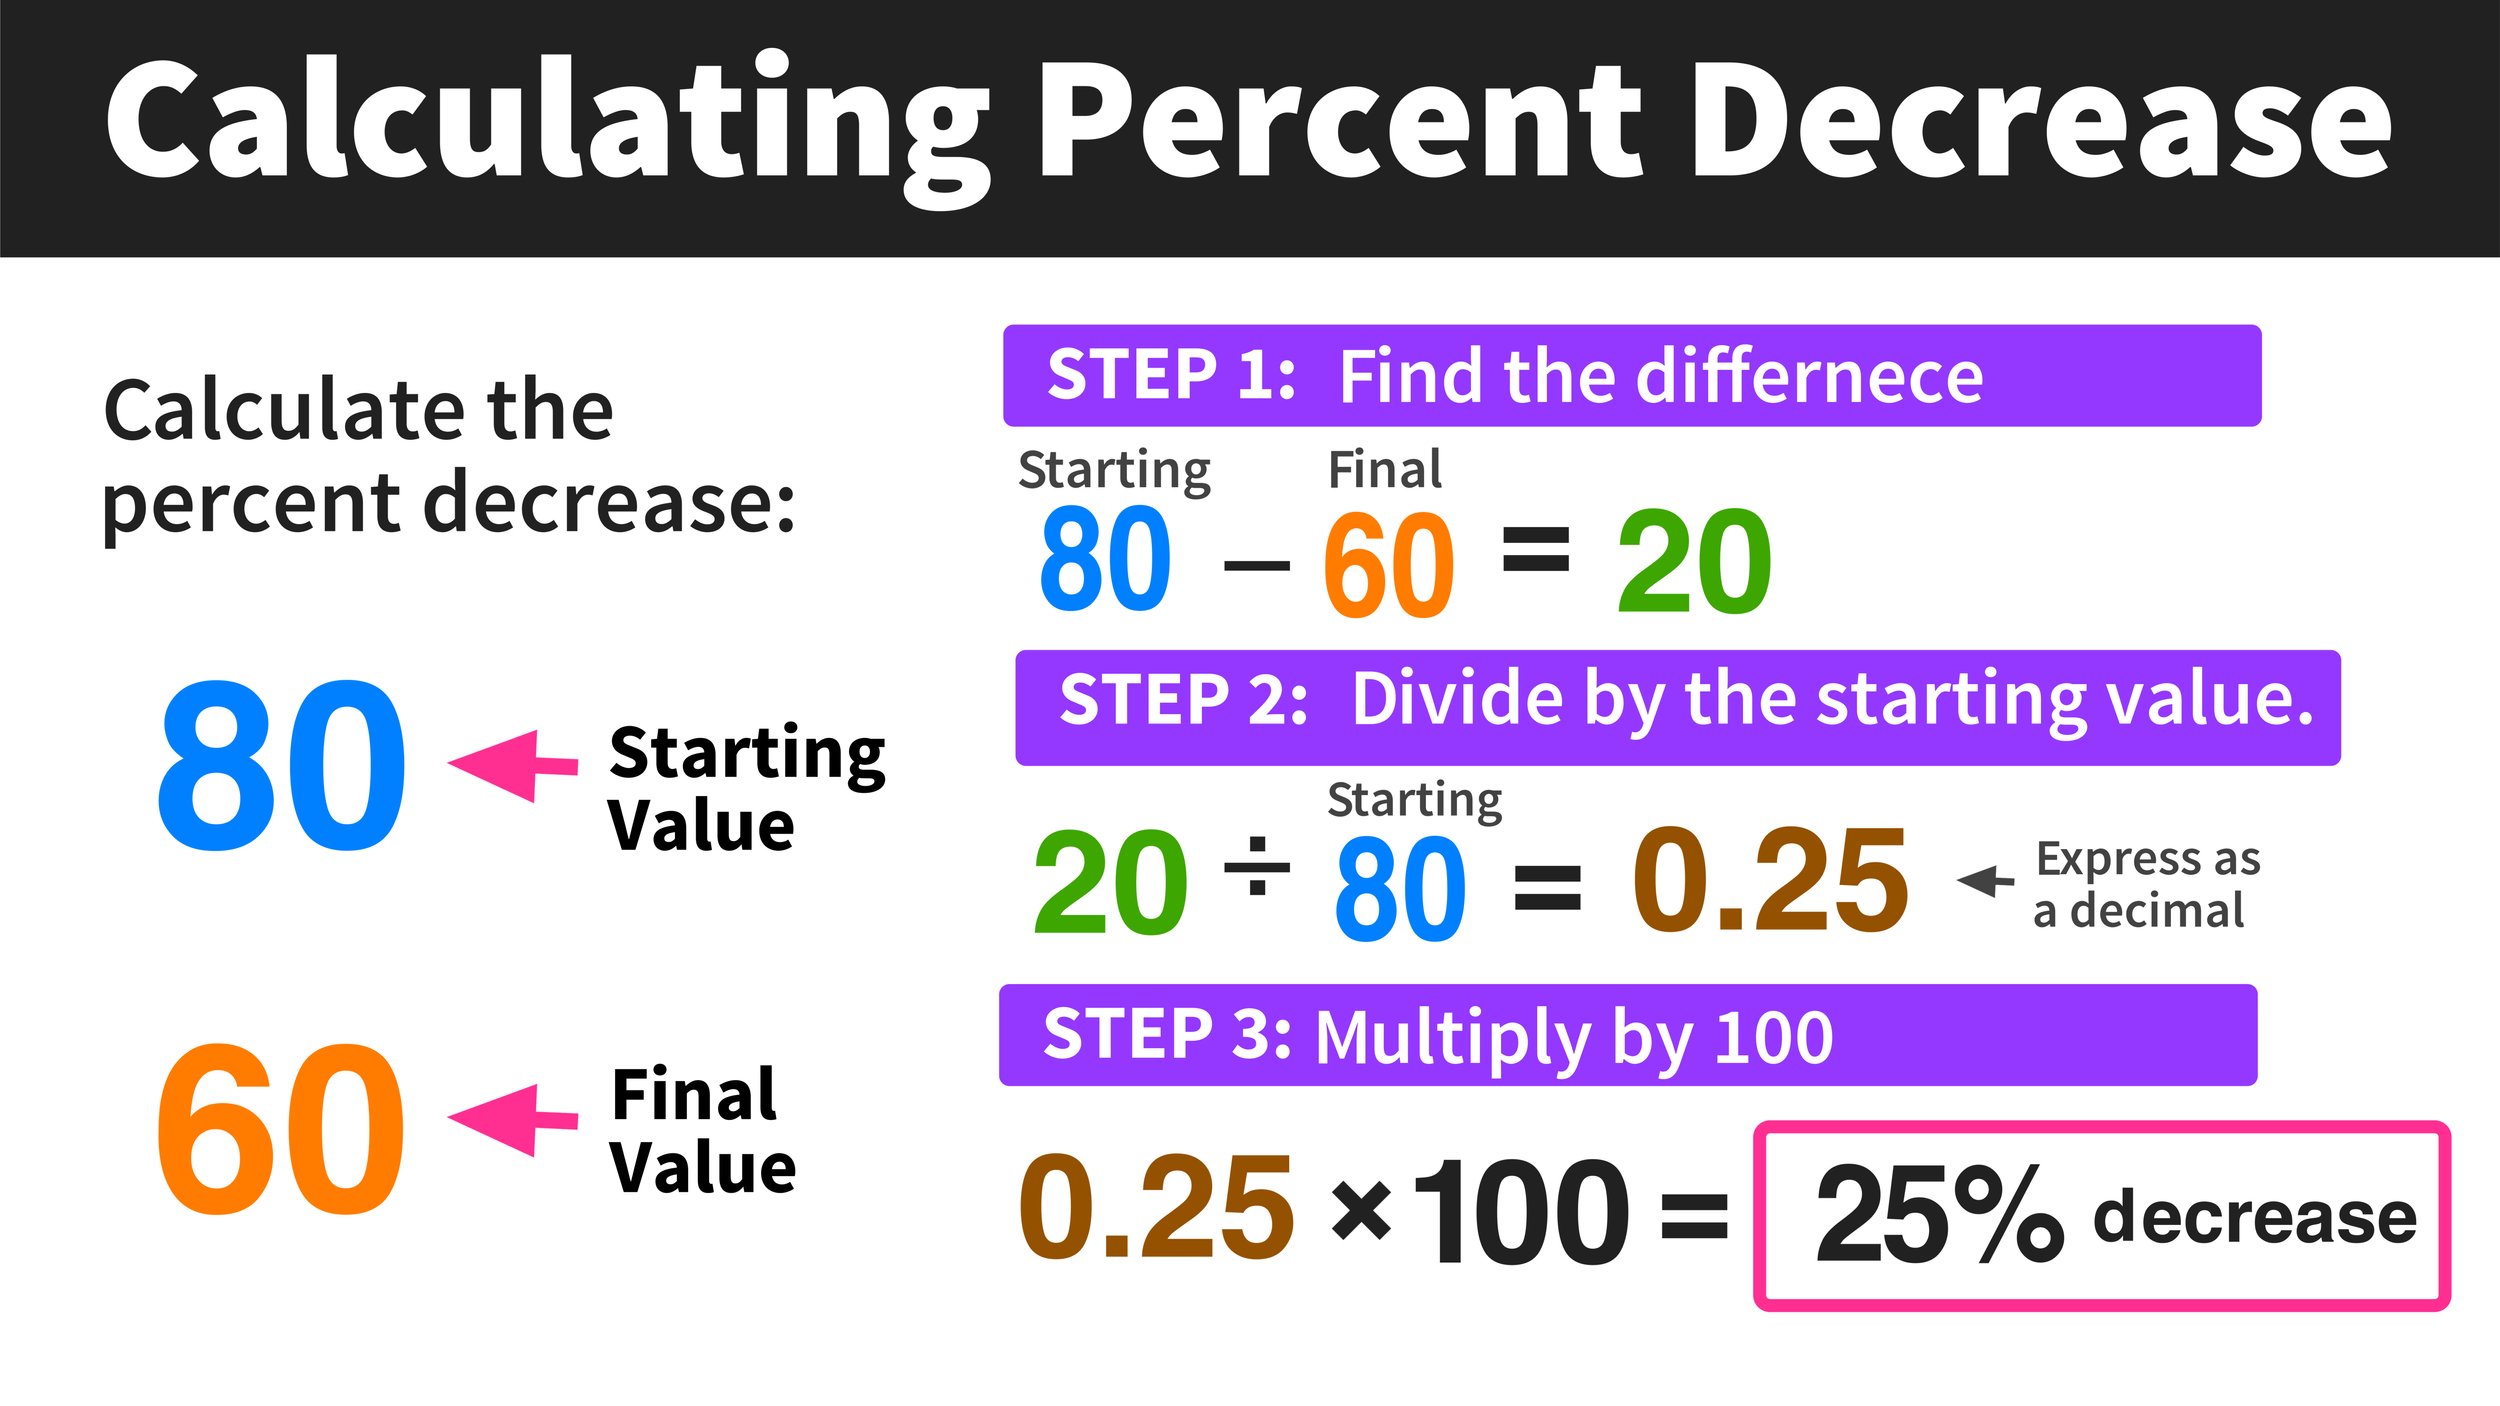
Formula Breakdown
The universal formula for percentage decline is:
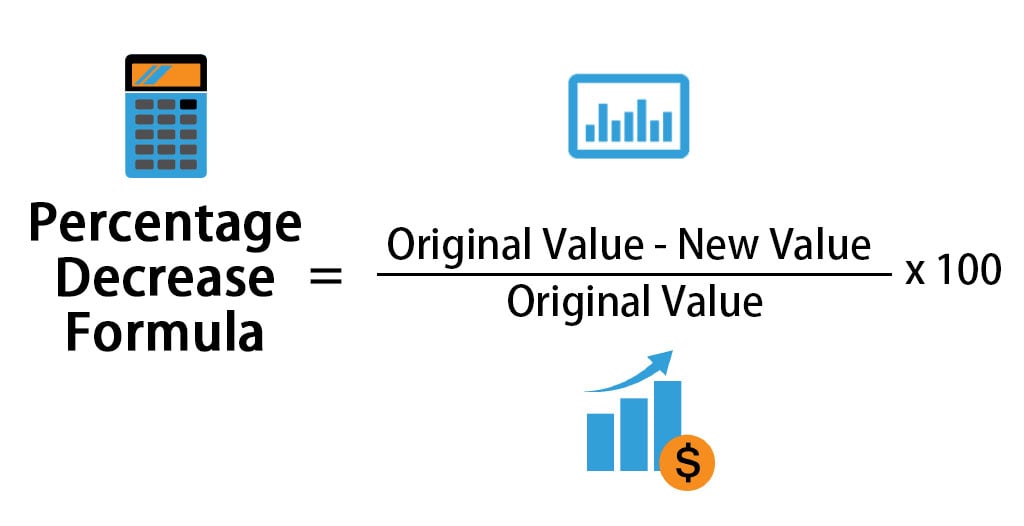
Percentage Decline = ((Initial Value – Final Value) / Initial Value) * 100%
Let’s break down each part:
Initial Value - Final Value: This first step calculates the absolute amount of the decrease. This is the raw dollar amount or numerical value that has been lost or reduced./ Initial Value: Dividing the absolute decrease by the initial value converts the decrease into a decimal ratio. This ratio represents the decline relative to the starting point.* 100%: Multiplying by 100 converts this decimal ratio into a percentage, making it easier to read and compare.
Practical Examples in Personal Finance
Percentage decline is highly relevant in managing personal finances.
Example 1: Investment Portfolio Decline
Imagine your investment portfolio was valued at $50,000 at the beginning of the year. Due to market volatility, it is now valued at $45,000.
- Initial Value = $50,000
- Final Value = $45,000
- Absolute Decrease = $50,000 – $45,000 = $5,000
- Ratio = $5,000 / $50,000 = 0.10
- Percentage Decline = 0.10 * 100% = 10%
Your investment portfolio has experienced a 10% decline.
Example 2: Value of an Asset Dropping
You bought a collectible for $200 last year. Its current market value is $160.
- Initial Value = $200
- Final Value = $160
- Absolute Decrease = $200 – $160 = $40
- Ratio = $40 / $200 = 0.20
- Percentage Decline = 0.20 * 100% = 20%
The collectible has declined in value by 20%.
Practical Examples in Business Finance
For businesses, calculating percentage decline is crucial for evaluating operational efficiency, market position, and overall financial health.
Example 1: Sales Revenue Decrease
A company’s quarterly sales revenue dropped from $1,200,000 in Q1 to $960,000 in Q2.
- Initial Value = $1,200,000
- Final Value = $960,000
- Absolute Decrease = $1,200,000 – $960,000 = $240,000
- Ratio = $240,000 / $1,200,000 = 0.20
- Percentage Decline = 0.20 * 100% = 20%
The company experienced a 20% decline in sales revenue.
Example 2: Stock Price Drop
The price of a company’s stock fell from $75.00 per share to $60.75 per share.
- Initial Value = $75.00
- Final Value = $60.75
- Absolute Decrease = $75.00 – $60.75 = $14.25
- Ratio = $14.25 / $75.00 = 0.19
- Percentage Decline = 0.19 * 100% = 19%
The stock price declined by 19%.
Applications Across Financial Sectors
The utility of percentage decline extends across virtually every facet of the financial world, offering insights into various economic and investment scenarios.
Investment Analysis
Investors frequently rely on percentage decline to assess the risk and performance of their portfolios. A significant percentage decline in a stock, bond, or mutual fund signals potential issues, prompting further investigation. It helps in understanding drawdowns—the peak-to-trough decline during a specific period—which is a key measure of investment risk. Moreover, comparing the percentage decline of various assets against a market index can reveal relative strength or weakness, informing diversification strategies and rebalancing decisions.
Business Performance Evaluation
For businesses, percentage decline is a critical metric for evaluating performance. A decline in revenue, profit margins, customer acquisition, or market share can indicate underlying operational problems, increased competition, or shifts in consumer demand. Monitoring these declines helps management pinpoint areas requiring immediate attention, formulate corrective strategies, and make informed decisions about resource allocation, product development, or marketing efforts. Financial statements often highlight year-over-year or quarter-over-quarter percentage changes, with declines signaling a need for deeper analysis.
Personal Budgeting and Expense Tracking
In personal finance, calculating percentage decline can be invaluable for budgeting and managing expenses. If you’ve set a goal to reduce a particular spending category, like dining out or subscriptions, calculating the percentage decline in those expenses month-over-month or year-over-year helps you track your progress. For instance, if your initial monthly dining out budget was $400 and you successfully cut it to $300, you’ve achieved a 25% decline in that expense, providing tangible evidence of your financial discipline.
Economic Indicators
At a macroeconomic level, percentage decline is used to report changes in key economic indicators. A decline in Gross Domestic Product (GDP) signifies economic contraction or recession. A percentage decline in unemployment rates, conversely, would be a positive sign of economic recovery. Conversely, a decline in inflation might be viewed positively, indicating greater purchasing power. Governments, central banks, and economists closely monitor these percentage changes to gauge the health of the economy, formulate fiscal and monetary policies, and predict future trends.
Common Pitfalls and Best Practices
While straightforward, misinterpretations or oversights in calculating and communicating percentage decline can lead to flawed conclusions.
Misinterpreting Percentage Points vs. Percentage Decline
One common mistake is confusing a percentage decline with a decline in “percentage points.” For example, if an interest rate drops from 10% to 5%, that’s a 5 percentage point drop. However, the percentage decline in the interest rate itself is ((10 – 5) / 10) * 100% = 50%. Always be clear whether you are referring to a reduction in percentage points or a relative percentage decline of a percentage value.
The Importance of Context and Timeframes
A percentage decline, by itself, tells only part of the story. Its significance is heavily reliant on context and the timeframe over which it occurred. A 15% decline in a volatile stock over a week might be expected, but a 15% decline in a stable bond fund over the same period would be alarming. Similarly, a 5% decline in revenue might be concerning for a growing company but acceptable for a mature business in a declining industry. Always specify the period (e.g., daily, monthly, annually) and the broader market or industry conditions when reporting or analyzing declines.
Using Financial Tools and Software
While manual calculation is possible, leveraging financial tools like spreadsheets (e.g., Microsoft Excel, Google Sheets) or specialized financial software can streamline the process, reduce errors, and facilitate more complex analysis. These tools allow for instant calculation across large datasets and easy visualization of trends, which is particularly useful for tracking multiple investments or business metrics. Many online calculators are also available for quick, single calculations.
Communicating Declines Effectively
When presenting percentage declines, clarity and transparency are paramount. Clearly state the initial and final values, the timeframe, and any relevant contextual information. Avoid jargon where plain language suffices. Visual aids like charts and graphs can be highly effective in illustrating declines over time, making complex data more accessible and understandable for stakeholders.
Leveraging Decline Data for Strategic Decision-Making
Understanding how to calculate percentage decline is merely the first step. The true value lies in using this information to drive strategic decision-making in both personal and business finance.
Identifying Trends and Patterns
By consistently tracking percentage declines in relevant metrics, you can identify emerging trends and patterns. Is a particular expense category consistently seeing month-over-month percentage decreases, indicating successful cost-cutting? Or is a specific investment repeatedly experiencing larger percentage declines during market corrections compared to its peers, suggesting higher volatility or risk? Recognizing these patterns allows for proactive adjustments rather than reactive responses.
Informing Investment Adjustments
For investors, a calculated percentage decline can be a trigger for portfolio adjustments. A significant decline in an asset might prompt a review of its fundamentals, a re-evaluation of your risk tolerance, or a decision to cut losses. Conversely, consistent smaller declines in a specific sector might signal a broader industry shift, leading you to diversify or pivot your investment strategy to more resilient areas.
Guiding Business Course Corrections
Businesses can leverage percentage decline data to make crucial course corrections. A noticeable decline in customer retention rates might lead to an overhaul of customer service strategies. A consistent percentage decrease in quarterly profits could necessitate a review of operational costs, pricing strategies, or product offerings. These insights enable management to diagnose problems, implement targeted solutions, and steer the company back on a path of growth and profitability.
Strengthening Personal Financial Resilience
On a personal level, using percentage decline calculations can significantly strengthen your financial resilience. By tracking declines in discretionary spending, you can identify areas to save more, build an emergency fund faster, or pay down debt more efficiently. Understanding the percentage decline in your assets during market downturns can help you prepare mentally and financially for volatility, preventing panic selling and enabling you to stick to a long-term financial plan.
In conclusion, the ability to accurately calculate and interpret percentage decline is a fundamental skill for anyone navigating the financial landscape. From individual investors managing their wealth to business leaders steering their organizations, and economists analyzing global trends, this metric provides invaluable insights into performance, risk, and opportunities. By mastering this calculation and applying it thoughtfully, you empower yourself to make more informed, strategic decisions that foster financial growth and stability.
aViewFromTheCave is a participant in the Amazon Services LLC Associates Program, an affiliate advertising program designed to provide a means for sites to earn advertising fees by advertising and linking to Amazon.com. Amazon, the Amazon logo, AmazonSupply, and the AmazonSupply logo are trademarks of Amazon.com, Inc. or its affiliates. As an Amazon Associate we earn affiliate commissions from qualifying purchases.