
In the dynamic world of finance, raw numbers alone often tell only part of the story. While knowing that your investment grew by $500 is helpful, understanding that it grew by 10% provides a far richer context, allowing for meaningful comparisons and informed decision-making. This crucial metric, known as percent change, is the bedrock of financial analysis, whether you’re managing personal savings, evaluating business performance, or dissecting market trends. Mastering its calculation is not just an academic exercise; it’s an indispensable skill that empowers you to interpret financial data with precision and insight. This article will demystify the process of calculating percent change, explore its profound significance in the realm of money, and equip you with the knowledge to apply it effectively in your financial journey.

Understanding the Fundamentals of Percent Change
Before diving into the mechanics, it’s essential to grasp what percent change truly represents and why it holds such sway in financial discourse. At its core, percent change is a relative measure that quantifies the degree of change between an old (or initial) value and a new (or final) value, expressed as a percentage of the old value.
What is Percent Change?
Simply put, percent change indicates how much a quantity has increased or decreased relative to its starting point. Unlike absolute change, which merely gives the numerical difference (e.g., $100), percent change normalizes this difference by expressing it as a proportion of the original amount. This normalization is critical because it provides perspective. An increase of $100 is spectacular for a $10 item, representing a 1000% gain, but insignificant for a $1,000,000 asset, where it’s a mere 0.01% uptick. Without percent change, comparing such disparate scenarios would be virtually impossible.
Why Percent Change Matters in Finance
In the financial sector, percent change is not just a statistical curiosity; it’s a fundamental lens through which performance, growth, and decline are assessed. It allows individuals and institutions to:
- Gauge Investment Performance: Whether it’s a stock’s daily movement, a mutual fund’s annual return, or the long-term growth of a retirement portfolio, percent change translates raw dollar figures into comparable performance metrics.
- Analyze Business Growth: Companies use percent change to track revenue growth, profit margin shifts, market share fluctuations, and operating expense reductions over various periods. This is vital for strategic planning and investor relations.
- Understand Economic Indicators: Inflation rates, GDP growth, interest rate shifts, and unemployment rate changes are all communicated and understood through the language of percent change, providing insights into the broader economic landscape.
- Facilitate Budgeting and Expense Control: On a personal level, tracking changes in monthly expenses, income, or savings rates using percentages helps in effective budgeting and identifying trends that might require adjustments.
- Evaluate Discounts and Markups: From a consumer perspective, understanding a “20% off” sale to a business calculating a “30% markup,” percent change is integral to pricing strategies and purchase decisions.
The Core Formula and Step-by-Step Calculation
The beauty of percent change lies in its straightforward, universal formula. Once you understand this foundational equation, you can apply it to a vast array of financial scenarios.
The Universal Formula
The formula for calculating percent change is:
Percent Change = ((New Value - Old Value) / Old Value) * 100%
Let’s break down each component:
- New Value (or Final Value): This is the quantity after the change has occurred.
- Old Value (or Initial Value): This is the quantity before the change occurred.
New Value - Old Value: This calculates the absolute change or the raw difference between the two numbers./ Old Value: Dividing the absolute change by the old value normalizes the change, turning it into a decimal representing the proportional change.* 100%: Multiplying by 100 converts this decimal proportion into a percentage, making it easier to interpret.
A positive result indicates a percentage increase, while a negative result signifies a percentage decrease.
Step-by-Step Walkthrough with Examples
Let’s apply this formula to common financial situations.
Example 1: Investment Growth (Stock Price Increase)
Imagine you bought shares of a company for $50 per share. A year later, the shares are trading at $60 per share. What is the percent change in your investment?
- Identify Old Value: $50
- Identify New Value: $60
- Calculate Absolute Change: $60 – $50 = $10
- Divide by Old Value: $10 / $50 = 0.20
- Multiply by 100: 0.20 * 100% = 20%
Interpretation: Your investment increased by 20%.
Example 2: Budget Variance (Expense Reduction)
Last month, your utility bill was $500. This month, through conscious effort, you reduced it to $450. What is the percent change in your utility expense?
- Identify Old Value: $500
- Identify New Value: $450
- Calculate Absolute Change: $450 – $500 = -$50
- Divide by Old Value: -$50 / $500 = -0.10
- Multiply by 100: -0.10 * 100% = -10%
Interpretation: Your utility expense decreased by 10%.
Example 3: Revenue Increase (Business Finance)
A small business reported quarterly revenue of $100,000 in Q1. In Q2, their revenue grew to $125,000. What was the percentage increase in revenue?
- Identify Old Value: $100,000
- Identify New Value: $125,000
- Calculate Absolute Change: $125,000 – $100,000 = $25,000
- Divide by Old Value: $25,000 / $100,000 = 0.25
- Multiply by 100: 0.25 * 100% = 25%
Interpretation: The business experienced a 25% increase in revenue.
Navigating Nuances and Common Pitfalls
While the core formula is straightforward, certain scenarios and common misinterpretations require a deeper understanding to avoid errors in financial analysis.
Handling Zero or Negative Initial Values
The percent change formula relies on dividing by the old (initial) value. This presents a challenge when the old value is zero.
- If Old Value is Zero: If you go from zero to any positive number (e.g., a company starts with $0 revenue and makes $1,000), the formula would involve division by zero, which is mathematically undefined. In such cases, one might describe the change as “infinite growth” or simply state the absolute change, as a percentage change is not meaningfully calculable in the traditional sense.
- If Old Value is Negative: Calculating percent change from a negative initial value can also yield counter-intuitive results. For example, going from a loss of -$100 to a loss of -$50 is an improvement, but applying the formula might suggest a “negative increase.” It’s often clearer to analyze the absolute change in such cases or to frame the improvement in terms of reaching profitability or reducing losses rather than a standard percent change. Context and clear communication are paramount here.
Percentage Points vs. Percent Change
This is a critical distinction in finance, especially when discussing interest rates, inflation, or survey data.
- Percentage Points: Refers to the absolute numerical difference between two percentages. For instance, if an interest rate increases from 5% to 6%, it has increased by 1 percentage point.
- Percent Change: Refers to the relative change of a percentage value. Using the same example, an interest rate increase from 5% to 6% is a
((6 - 5) / 5) * 100% = 20%percent change. This means the interest rate itself has increased by 20% of its original value.
Confusing these two can lead to significant misinterpretations of financial news or investment returns. Always clarify whether you are discussing a change in “percentage points” or a “percent change” of a percentage.
Compounding Effects and Multi-Period Analysis
Percent change is most direct when applied to a single period. However, in finance, performance often spans multiple periods, and these changes compound. A simple average of annual percent changes will not accurately reflect multi-year growth.
- For consistent multi-period analysis, financial professionals often use the Compound Annual Growth Rate (CAGR). CAGR smooths out volatility and provides a representative annual growth rate over a specified period, taking into account the compounding effect. While the percent change formula gives you the change between two points, CAGR helps to understand the average annual rate that got you from the start to the end point over several years.
Practical Applications in Personal and Business Finance
The ability to calculate and interpret percent change is a cornerstone for informed financial decision-making, impacting virtually every aspect of personal wealth management and corporate strategy.
Personal Finance
For individuals, percent change is an invaluable tool for taking control of their financial health:
- Tracking Investment Performance: Monitoring the percent change of your stock portfolio, mutual funds, or retirement accounts helps you understand actual returns, compare performance against benchmarks, and make timely adjustments to your investment strategy.
- Analyzing Savings Growth: Seeing your savings account grow by 5% versus just knowing it increased by $100 gives a clearer picture of your progress towards financial goals.
- Understanding Inflation’s Impact: Observing how the cost of living (inflation) changes by a certain percentage helps you grasp the erosion of purchasing power and adjust your financial planning accordingly.
- Evaluating Loan and Interest Rate Changes: When interest rates on loans or mortgages fluctuate, understanding the percent change in these rates can have significant implications for your monthly payments and overall debt burden.
- Budgeting and Expense Control: Comparing current expenses to previous periods using percent change enables you to pinpoint areas where spending has increased or decreased, facilitating better budget management.
Business Finance and Investing
In the corporate world and among investors, percent change is central to evaluating performance, identifying trends, and making strategic choices:
- Assessing Revenue and Profit Growth: Businesses religiously track the percent change in revenue, gross profit, and net income quarter-over-quarter and year-over-year to gauge their operational success and market penetration.
- Analyzing Market Share Changes: Companies use percent change to understand shifts in their competitive position within an industry.
- Evaluating Investment Returns (ROI): Investors and companies alike calculate the percent change in the value of an investment (Return on Investment) to determine its profitability and efficiency.
- Comparing Company Performance Metrics: When comparing two companies, their absolute profits might differ vastly. However, comparing their year-over-year profit percent change offers a more apples-to-apples comparison of their growth trajectories.
- Discounting and Markups: Retailers use percent change to calculate discounts on sale items and apply markups to determine selling prices from their cost.
Tools and Technologies for Calculating Percent Change
While the manual calculation is straightforward, modern financial practice often leverages technology for efficiency, especially when dealing with large datasets or complex analyses.
Spreadsheets (Excel, Google Sheets)
For most financial professionals and even savvy individuals, spreadsheet software like Microsoft Excel or Google Sheets is the go-to tool. They allow you to:
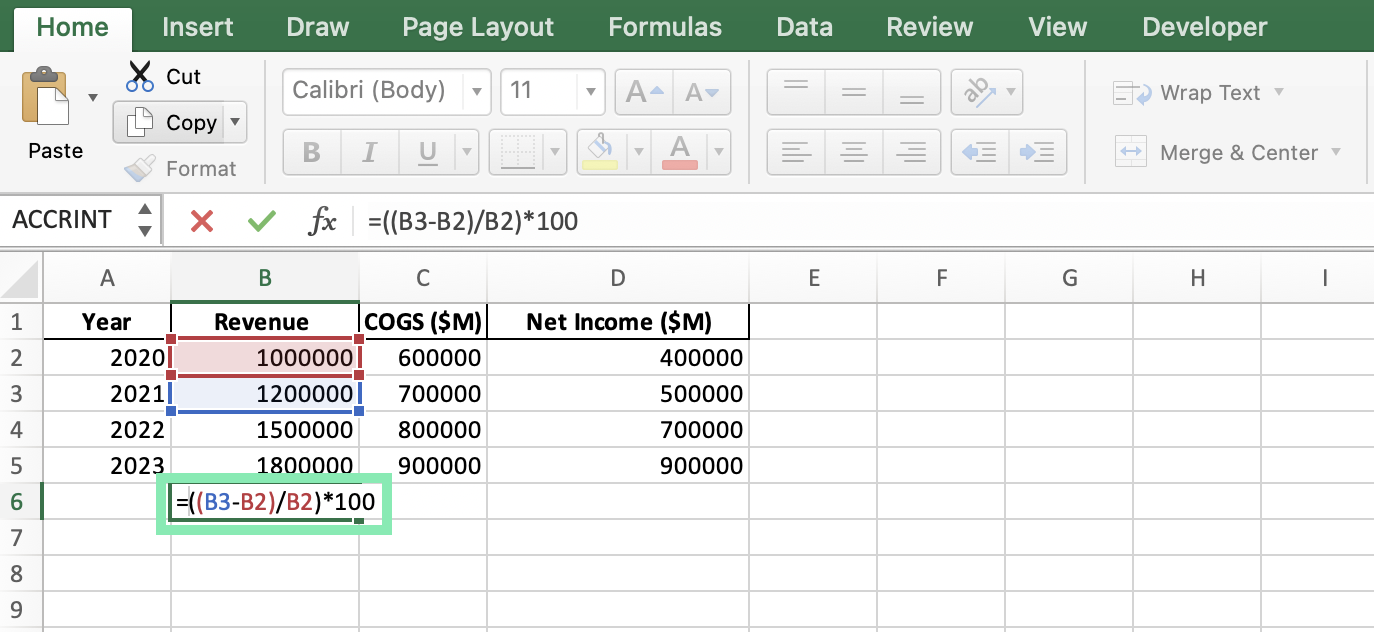
- Automate Calculations: Input the formula once (e.g.,
=(B2-A2)/A2and format as a percentage) and drag it across hundreds or thousands of rows to instantly calculate percent changes for entire datasets. - Visualize Data: Combine percent change calculations with charts and graphs to visually represent trends over time, making financial insights more accessible.
- Perform “What-If” Analysis: Easily change old or new values to see the immediate impact on the percent change, facilitating scenario planning.
Financial Calculators and Online Tools
For quick, one-off calculations, dedicated financial calculators (both physical and online) often have built-in functions for percentage calculations, including percent change. Numerous websites also offer simple, user-friendly percent change calculators.

Programming Languages (Python, R – for Advanced Analysis)
For advanced financial modeling, algorithmic trading, or big data analysis, programming languages like Python or R are indispensable. Libraries within these languages can handle complex financial calculations, including percent change across vast datasets, allowing for sophisticated trend analysis, predictive modeling, and automated reporting. This level of automation is critical in quantitative finance and large-scale business intelligence.
In conclusion, understanding how to calculate percent change is more than just knowing a formula; it’s about gaining a critical analytical skill that transforms raw numbers into meaningful financial intelligence. From assessing personal investment growth to dissecting corporate earnings reports, this fundamental concept empowers you to make informed decisions, comprehend economic narratives, and navigate the intricate world of money with confidence and clarity. By mastering this core calculation, you unlock a deeper understanding of financial dynamics, making you a more astute investor, a more effective manager, and a more financially literate individual.
aViewFromTheCave is a participant in the Amazon Services LLC Associates Program, an affiliate advertising program designed to provide a means for sites to earn advertising fees by advertising and linking to Amazon.com. Amazon, the Amazon logo, AmazonSupply, and the AmazonSupply logo are trademarks of Amazon.com, Inc. or its affiliates. As an Amazon Associate we earn affiliate commissions from qualifying purchases.