
In the dynamic world of finance, change is the only constant. Whether you’re tracking your personal investments, analyzing business performance, or simply managing a household budget, understanding how values shift over time is paramount. While absolute changes provide a raw figure, it’s the relative change that often tells the more compelling story, offering context and comparability. Among these crucial metrics, percent decrease stands out as an indispensable tool for identifying reductions, evaluating efficiency, and making informed financial decisions.
A percent decrease measures the relative reduction between an initial value and a final value. It transforms a raw drop in numbers into a universally understood percentage, allowing for standardized comparisons across different scales and scenarios. For instance, a $100 decrease might seem significant, but its true impact can only be assessed when weighed against the original amount. Was it a $100 drop from $100,000 (a minor 0.1% decrease) or a $100 drop from $200 (a substantial 50% decrease)? Without the context of the percentage, the former might be overlooked while the latter could signal a crisis. This article will demystify the calculation of percent decrease, explore its myriad applications across personal and business finance, and equip you with the knowledge to leverage this powerful metric effectively.
Understanding the Fundamentals: What is Percent Decrease?
Before diving into calculations, it’s essential to grasp the core concept behind percent decrease and why it holds such significance in financial analysis. This fundamental understanding forms the bedrock for its practical application.
The Core Concept Explained
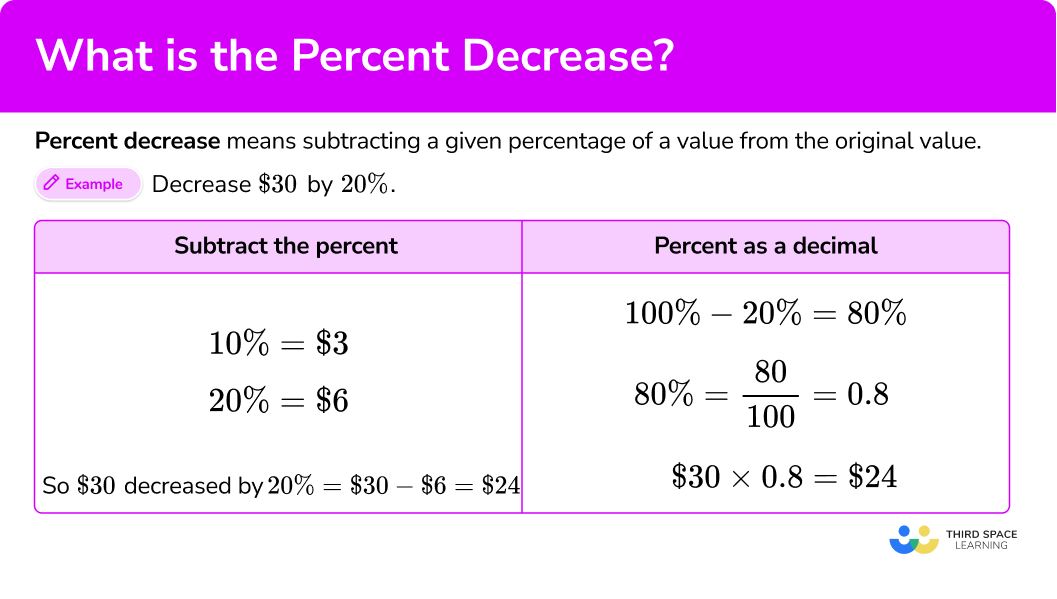
At its heart, percent decrease quantifies the proportional reduction in a value relative to its original state. It’s a way of expressing how much something has shrunk or declined, not in absolute units (like dollars or units), but as a fraction of its starting point, then multiplied by 100 to convert it into a percentage.
Imagine you have a certain amount of money, and over a period, that amount reduces. The absolute decrease is simply the difference between the initial amount and the final amount. However, this absolute figure alone doesn’t always provide sufficient insight. For example, losing $50 from a $100 wallet is far more impactful than losing $50 from a $10,000 investment portfolio. Percent decrease normalizes this change, providing a standardized measure that is easy to interpret and compare across different contexts. It provides a common language for expressing decline, making it easier to communicate financial performance or understand economic shifts.
Why This Metric is Crucial for Financial Analysis
The importance of percent decrease in financial analysis cannot be overstated. It offers a clear, concise, and comparable way to understand negative changes.
Firstly, it provides context. A large dollar decrease may appear alarming, but if it represents a small percentage of a vast sum, its actual impact might be minimal. Conversely, a seemingly small dollar amount can signify a catastrophic percentage decrease if the initial value was low. This contextualization is vital for proper risk assessment and performance evaluation.
Secondly, percent decrease enables standardized comparisons. You can compare the efficiency of expense reduction across different departments, analyze the drop in sales for various product lines, or contrast investment losses in different market sectors, regardless of their initial monetary values. This allows for benchmarking and identifying areas of concern or success.
Thirdly, it’s a key indicator for identifying trends and anomalies. A consistent percent decrease in a particular metric (e.g., quarterly profits) can signal a systemic problem requiring immediate attention. Conversely, an unexpected large percent decrease might point to a one-time event or a data error that needs investigation. By tracking percent decrease over time, financial professionals and individuals can spot patterns, anticipate future challenges, and make proactive adjustments to their strategies. It forms a critical component of financial health checks, risk management, and strategic planning in both personal and business contexts.
The Step-by-Step Guide to Calculating Percent Decrease
Calculating percent decrease is a straightforward process once you understand the formula and the steps involved. Mastering this calculation is fundamental for anyone engaging in financial analysis.
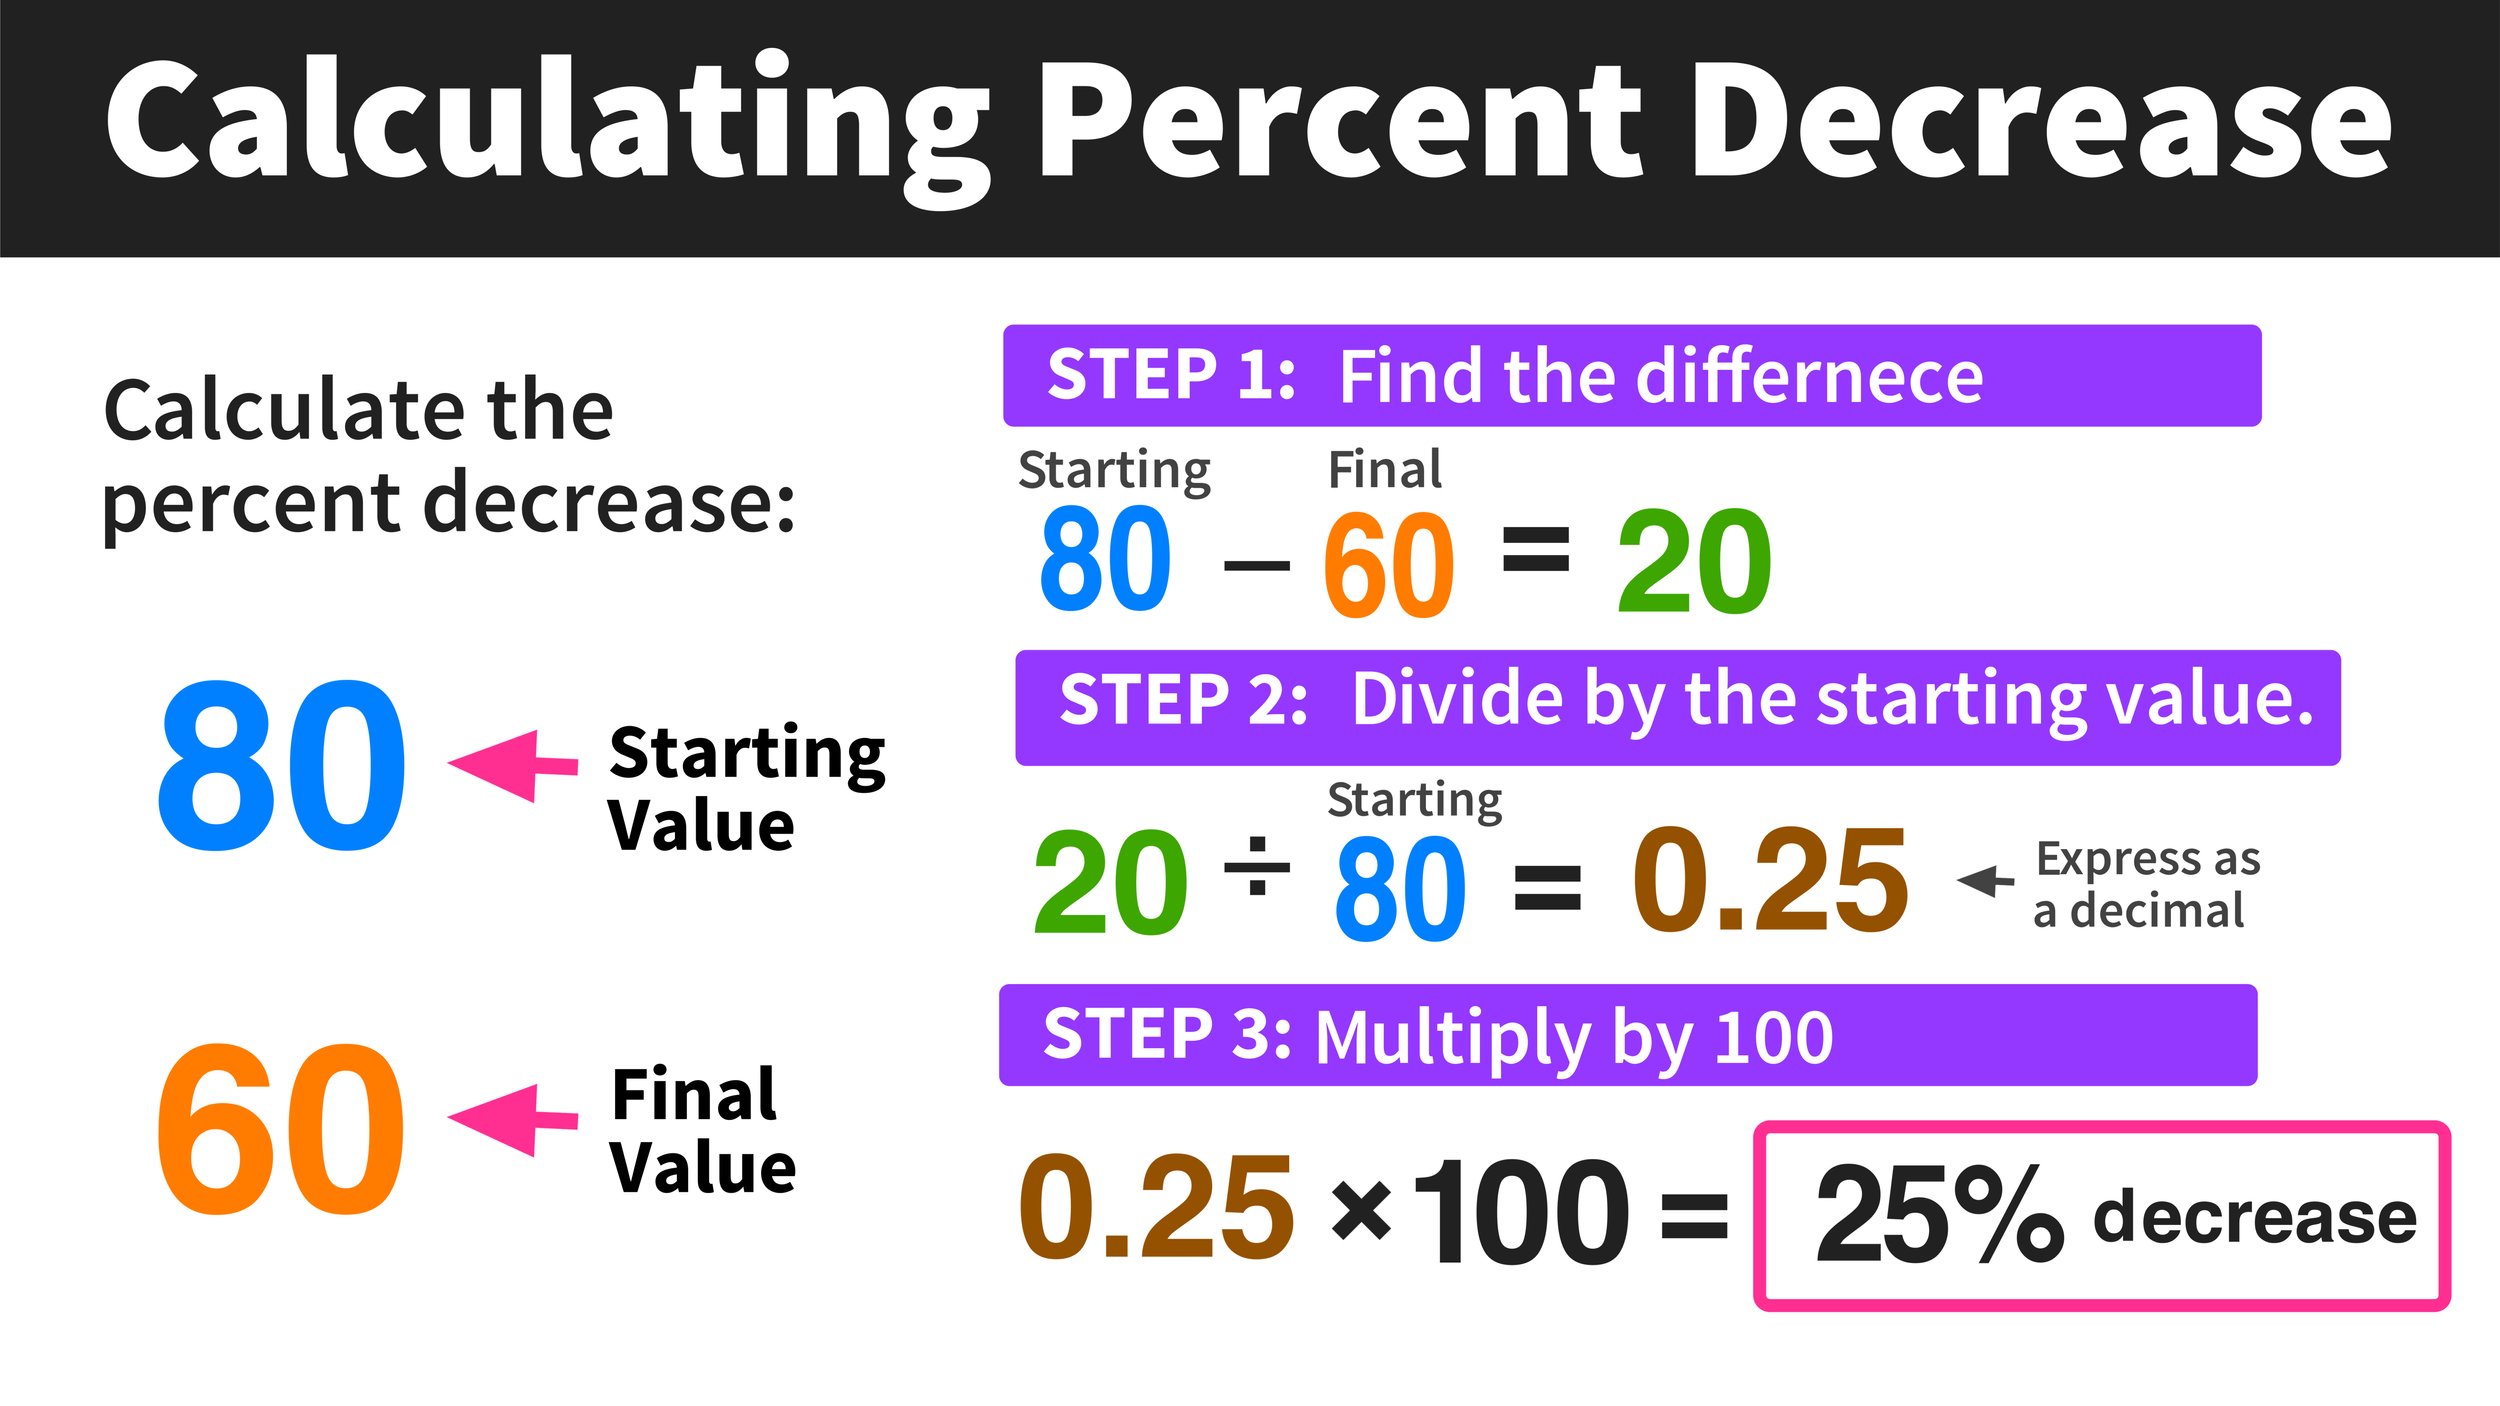
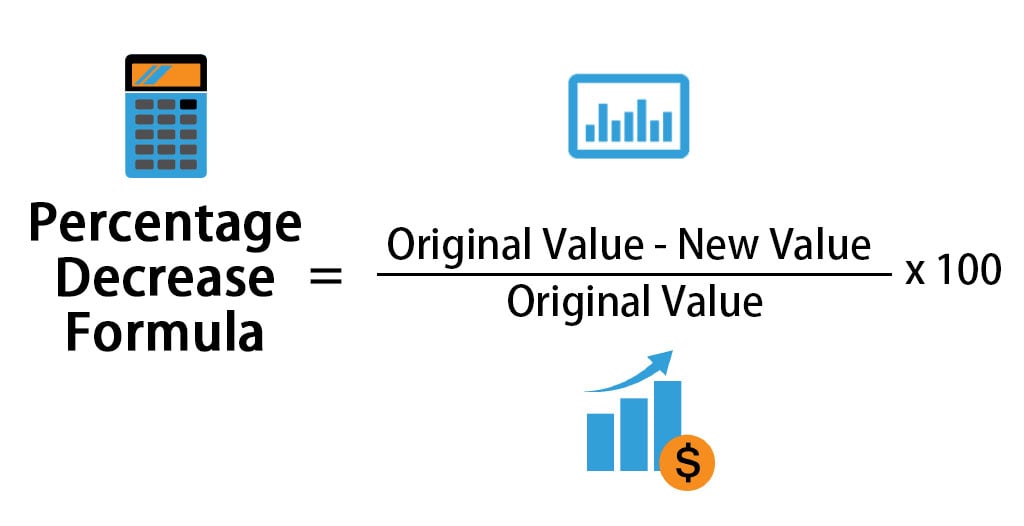
The general formula for percent decrease is:
Percent Decrease = ((Initial Value - Final Value) / Initial Value) * 100%
Let’s break down each step:
Step 1: Identify Initial and Final Values
The very first step is to clearly define the two values you’re comparing:
- Initial Value (or Original Value): This is the starting point, the amount you had before the decrease occurred.
- Final Value (or New Value): This is the amount after the decrease has taken place.
It’s crucial that the initial value is greater than the final value for a decrease to have occurred. If the final value is greater than the initial value, you’re looking at a percent increase.
Step 2: Calculate the Absolute Decrease
Once you have your initial and final values, find the absolute difference between them. This tells you the raw amount by which the value has fallen.
Absolute Decrease = Initial Value - Final Value
This result will always be a positive number if a decrease has indeed occurred.
Step 3: Divide by the Initial Value
Now, take the absolute decrease you calculated in Step 2 and divide it by the original (initial) value. This step converts the absolute decrease into a decimal representing its proportion relative to the starting point.
Proportion of Decrease = Absolute Decrease / Initial Value
Proportion of Decrease = (Initial Value - Final Value) / Initial Value
The result of this division will be a decimal between 0 and 1.
Step 4: Convert to a Percentage
The final step is to convert the decimal proportion into a percentage. You do this by multiplying the result from Step 3 by 100.
Percent Decrease = (Proportion of Decrease) * 100
Percent Decrease = ((Initial Value - Final Value) / Initial Value) * 100%
Adding the percent sign (%) at the end clearly denotes that the number represents a percentage.
Illustrative Examples in Personal Finance
Let’s apply this to common personal finance scenarios:
Example 1: Utility Bill Reduction
- Initial electricity bill: $150
- Final electricity bill: $120
- Step 1: Initial = $150, Final = $120
- Step 2: Absolute Decrease = $150 – $120 = $30
- Step 3: Proportion of Decrease = $30 / $150 = 0.2
- Step 4: Percent Decrease = 0.2 * 100% = 20%
- Interpretation: Your electricity bill decreased by 20%.
Example 2: Investment Portfolio Drop
- Initial portfolio value: $50,000
- Final portfolio value: $47,500
- Step 1: Initial = $50,000, Final = $47,500
- Step 2: Absolute Decrease = $50,000 – $47,500 = $2,500
- Step 3: Proportion of Decrease = $2,500 / $50,000 = 0.05
- Step 4: Percent Decrease = 0.05 * 100% = 5%
- Interpretation: Your investment portfolio decreased by 5%.
Illustrative Examples in Business Finance
The same principles apply directly to business scenarios:
Example 1: Quarterly Sales Decline
- Initial quarterly sales: $250,000
- Final quarterly sales: $200,000
- Step 1: Initial = $250,000, Final = $200,000
- Step 2: Absolute Decrease = $250,000 – $200,000 = $50,000
- Step 3: Proportion of Decrease = $50,000 / $250,000 = 0.2
- Step 4: Percent Decrease = 0.2 * 100% = 20%
- Interpretation: The company’s sales decreased by 20% this quarter.
Example 2: Inventory Shrinkage
- Initial inventory count: 1,200 units
- Final inventory count: 1,140 units
- Step 1: Initial = 1,200, Final = 1,140
- Step 2: Absolute Decrease = 1,200 – 1,140 = 60 units
- Step 3: Proportion of Decrease = 60 / 1,200 = 0.05
- Step 4: Percent Decrease = 0.05 * 100% = 5%
- Interpretation: The inventory experienced a 5% shrinkage.
By consistently following these steps, you can accurately calculate percent decrease for any relevant financial data, providing valuable insights into negative trends and performance.
Practical Applications Across Financial Scenarios
The utility of percent decrease extends across virtually every facet of financial management, from individual budgeting to corporate strategy and economic analysis. Its versatility makes it an essential tool for understanding and responding to various financial shifts.
Analyzing Investment Performance
For investors, percent decrease is a critical metric for understanding market downturns and evaluating portfolio risk. When stock prices fall, or a mutual fund loses value, expressing this change as a percentage allows investors to gauge the severity of the loss in proportion to their initial capital. For instance, knowing a stock dropped by 15% immediately conveys more meaning than just stating it lost $5 per share, especially if comparing it to another stock that lost $10 but only represented a 5% decrease of a much higher initial price. It’s used to:
- Track individual asset depreciation: Monitor the decline in value of specific stocks, bonds, or real estate holdings.
- Evaluate portfolio drawdowns: Understand the peak-to-trough decline in an overall investment portfolio, which is a key risk metric.
- Compare investment losses: Assess which investments are experiencing the most significant proportional declines during market corrections.
Tracking Budget Adherence and Expense Reduction
In personal and business budgeting, percent decrease is invaluable for identifying areas where costs have been successfully cut or where spending has gone down. It helps individuals and organizations to:
- Monitor expense control: If a budget aims for a 10% reduction in utility costs, calculating the percent decrease in your electricity bill month-over-month (as per our earlier example) directly tells you if you’re meeting your target.
- Identify saving opportunities: Comparing current spending to previous periods using percent decrease can highlight categories where conscious efforts or market conditions have led to lower expenditures, reinforcing positive financial habits.
- Assess the impact of cost-cutting measures: After implementing new strategies to reduce operational costs (e.g., negotiating better supplier deals, improving energy efficiency), percent decrease provides a quantifiable measure of their effectiveness.
Evaluating Business Sales and Profitability Trends
For businesses, percent decrease is a core metric for operational and strategic analysis. It helps in understanding market dynamics, product performance, and overall financial health. Businesses use it to:
- Analyze sales declines: Determine the proportional drop in revenue for specific products, services, or geographic regions over time. A significant percent decrease in sales often triggers a review of marketing strategies, pricing, or product relevance.
- Monitor profit margin erosion: Calculate the percent decrease in gross profit margin or net profit margin to understand how efficiently a company is converting sales into profit, indicating potential issues with costs or pricing.
- Assess customer churn: If the number of subscribers or recurring customers decreases, calculating the percent decrease provides insight into customer retention challenges, prompting efforts to improve service or product offerings.
- Track inventory shrinkage: Measure the proportional loss of inventory due to theft, damage, or obsolescence, crucial for inventory management and loss prevention.
Understanding Economic Indicators
At a macro level, percent decrease is fundamental to economic analysis and policy-making. Economists, policymakers, and financial journalists frequently use it to describe shifts in national and global economies:
- GDP contraction: A decrease in a country’s Gross Domestic Product (GDP) from one quarter to the next, expressed as a percent decrease, signals an economic recession.
- Unemployment rate changes: While typically measured as a raw percentage, changes in the unemployment rate itself can be expressed as a percent decrease (e.g., if unemployment drops from 6% to 5.4%, that’s a 10% decrease in the rate of unemployment, not a 0.6% decrease).
- Inflation/Deflation: A percent decrease in price indices can indicate deflation, a significant economic concern.
- Market corrections: When stock markets experience a general decline, the percent decrease from a peak is widely reported to describe the extent of the correction or bear market.
Across all these applications, percent decrease provides a standardized and powerful lens through which to view and interpret negative financial changes, enabling more informed decision-making.
Common Pitfalls and Best Practices
While calculating percent decrease is straightforward, its effective application requires awareness of common pitfalls and adherence to best practices to ensure accurate and meaningful interpretations. Misinterpreting this metric can lead to poor financial decisions.
The Importance of Accurate Baseline Data
The accuracy of your percent decrease calculation is entirely dependent on the quality and integrity of your initial and final values.
- Garbage In, Garbage Out: If your initial or final data points are incorrect, estimated poorly, or derived from inconsistent methodologies, your percent decrease will be flawed and misleading. Ensure data is verified, consistent, and sourced reliably.
- Comparable Timeframes: When comparing values, ensure they represent equivalent timeframes. Comparing a month’s sales to a quarter’s sales will yield an irrelevant percent decrease. Always compare like with like (e.g., Q1 vs. Q4, or Jan 2023 vs. Jan 2024).
- Consistent Definitions: Ensure the metrics themselves are defined consistently. If “sales” included returns in one period but not another, your comparison will be skewed.
Contextualizing the Decrease: Relative vs. Absolute
A percentage decrease alone doesn’t always tell the whole story. It’s crucial to consider both the relative (percent) and absolute (raw number) changes, as well as the broader context.
- Small Base, Big Percentage: A small absolute decrease can look like a massive percent decrease if the initial value was very low. For example, a drop from $20 to $10 is a 50% decrease, which sounds alarming. However, in the context of a million-dollar company, a $10 decrease might be negligible. Conversely, a small percentage decrease on a very large number can still represent a significant absolute loss.
- The “Why” Behind the “What”: Don’t just report the percent decrease; investigate its underlying causes. A 10% drop in sales might be due to a market downturn, increased competition, a product recall, or a planned strategic shift. Understanding the cause is vital for developing appropriate responses.
- Thresholds and Benchmarks: Compare your calculated percent decrease against industry benchmarks, historical averages, or internal targets. A 5% decrease might be acceptable in a tough market but alarming in a booming one.
When Percent Decrease Might Be Misleading
There are specific situations where relying solely on percent decrease can be deceptive:
- Approaching Zero Initial Values: As the initial value gets closer to zero, even a tiny absolute decrease can result in an extremely large or even undefined percent decrease if the initial value hits zero. For instance, if expenses drop from $1 to $0.50, that’s a 50% decrease. If they drop from $0.10 to $0.05, it’s also a 50% decrease, but the practical implication of that $0.05 difference is often negligible.
- Negative Initial Values: Percent decrease is generally not applicable or meaningful when the initial value is negative. The mathematical operation would lead to counterintuitive or undefined results. In such cases, absolute change or other metrics are more appropriate.
- Seasonal or Cyclical Data: Be wary of comparing periods that have known seasonal variations without proper adjustment. A decrease in retail sales from December to January is expected and doesn’t necessarily indicate a problem if it’s a typical seasonal dip. Year-over-year comparisons or seasonally adjusted data are often more insightful.
By adhering to these best practices, you can ensure that your use of percent decrease provides robust, actionable insights rather than misleading conclusions, empowering more accurate financial analysis and decision-making.
Leveraging Financial Tools for Percent Decrease Calculations
While manual calculation of percent decrease is simple for one-off instances, financial tools significantly streamline the process for analyzing larger datasets and ongoing monitoring. Understanding how to use these tools is crucial for efficiency and accuracy in both personal and business finance.
Excel/Google Sheets Formulas
Spreadsheets like Microsoft Excel and Google Sheets are perhaps the most ubiquitous and powerful tools for financial calculations, including percent decrease. They allow for quick calculations across many data points and offer robust analytical capabilities.
To calculate percent decrease in a spreadsheet:
- Input Your Data: Place your initial value in one cell (e.g.,
A2) and your final value in another (e.g.,B2). - Apply the Formula: In a third cell (e.g.,
C2), enter the formula:
=( (A2 - B2) / A2 )
This will give you the decimal proportion of the decrease. - Format as Percentage: To display this as a percentage, simply select the cell
C2and click the “Percent Style” button (usually found in the Number group on the Home tab in Excel, or Format > Number > Percent in Google Sheets). The spreadsheet will automatically multiply by 100 and add the percent sign.
Example:
- Cell A2 (Initial Value):
150 - Cell B2 (Final Value):
120 - Cell C2 (Formula):
=((A2-B2)/A2)will show0.2 - Formatting C2 as a percentage will display
20.00%
For a range of data, you can simply drag the formula down to apply it to multiple rows, instantly calculating percent decreases across various items or time periods.
Online Calculators and Software
Beyond spreadsheets, numerous online calculators and specialized financial software provide quick solutions for percent decrease, especially for those who need a rapid answer without setting up a sheet or for more complex financial modeling.
- Dedicated Online Percent Change Calculators: A quick search for “percent decrease calculator” will yield many free online tools. You simply input the initial and final values, and the calculator provides the result instantly. These are great for quick checks or single calculations.
- Financial Software and Platforms:
- Accounting Software (e.g., QuickBooks, Xero): Often, these platforms will generate reports that automatically show percent changes (increases or decreases) in revenue, expenses, and profit from one period to the next. They handle the underlying calculations and present the data in an easily digestible format.
- Investment Tracking Platforms (e.g., Fidelity, Vanguard, Robinhood): These platforms typically display the daily, weekly, monthly, or yearly percent change in your portfolio value or individual stock holdings. When values go down, they show a percent decrease.
- Business Intelligence (BI) Tools: For larger businesses, BI dashboards (like Tableau, Power BI) are designed to visualize data trends, including percent decreases, across various business metrics in real-time.
- Personal Finance Apps: Many budgeting and personal finance apps will show you how your spending in a category has decreased (or increased) month-over-month as a percentage.
These tools not only automate the calculation but also integrate percent decrease into broader financial reporting and analysis, saving time and reducing the potential for manual errors. Leveraging them allows you to focus more on interpreting the insights rather than just crunching the numbers.
Empowering Financial Decisions with Percent Decrease
The ability to accurately find and interpret percent decrease is more than just a mathematical exercise; it’s a cornerstone of astute financial management. In a world where financial landscapes are constantly shifting, this metric serves as a vital compass, guiding individuals and businesses through periods of contraction and enabling them to respond proactively.
From diligently tracking a household budget to analyzing the nuances of investment portfolio performance or dissecting the intricate financial statements of a corporation, percent decrease provides an immediate, comparable, and actionable measure of negative change. It transforms raw numbers into meaningful insights, highlighting where values are shrinking, where efficiency gains have been made, or where potential risks are emerging.
By consistently applying the step-by-step calculation, being mindful of the data’s context, and utilizing the array of financial tools available, you empower yourself to make more informed, data-driven decisions. Whether you’re aiming to cut personal expenses by a target percentage, understand the true impact of a market downturn, or diagnose a decline in business profitability, percent decrease is your reliable companion. Embrace this powerful metric, and elevate your financial literacy and decision-making capabilities to navigate the complexities of money management with greater confidence and precision.
aViewFromTheCave is a participant in the Amazon Services LLC Associates Program, an affiliate advertising program designed to provide a means for sites to earn advertising fees by advertising and linking to Amazon.com. Amazon, the Amazon logo, AmazonSupply, and the AmazonSupply logo are trademarks of Amazon.com, Inc. or its affiliates. As an Amazon Associate we earn affiliate commissions from qualifying purchases.