
The stock market, with its relentless fluctuations and intricate web of data, can appear daunting to the uninitiated. Yet, for those who learn to decipher its language, it offers a profound insight into economic health, corporate performance, and the collective sentiment of investors worldwide. “Reading the stock market” isn’t about predicting the future with absolute certainty; rather, it’s about understanding the forces at play, interpreting available information, and making informed decisions that align with one’s financial goals. This guide aims to demystify the process, providing a structured approach to comprehending the market’s signals and developing a robust investment perspective.
Understanding the Fundamental Language of Market Data
Before delving into complex analytical techniques, a foundational understanding of key market data points is essential. These are the basic building blocks that inform all subsequent analysis, serving as the market’s vocabulary.
Decoding Stock Quotes and Key Metrics
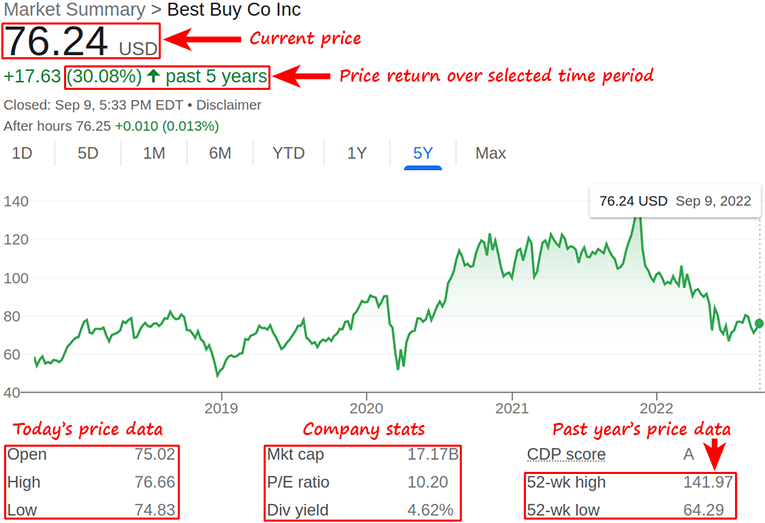
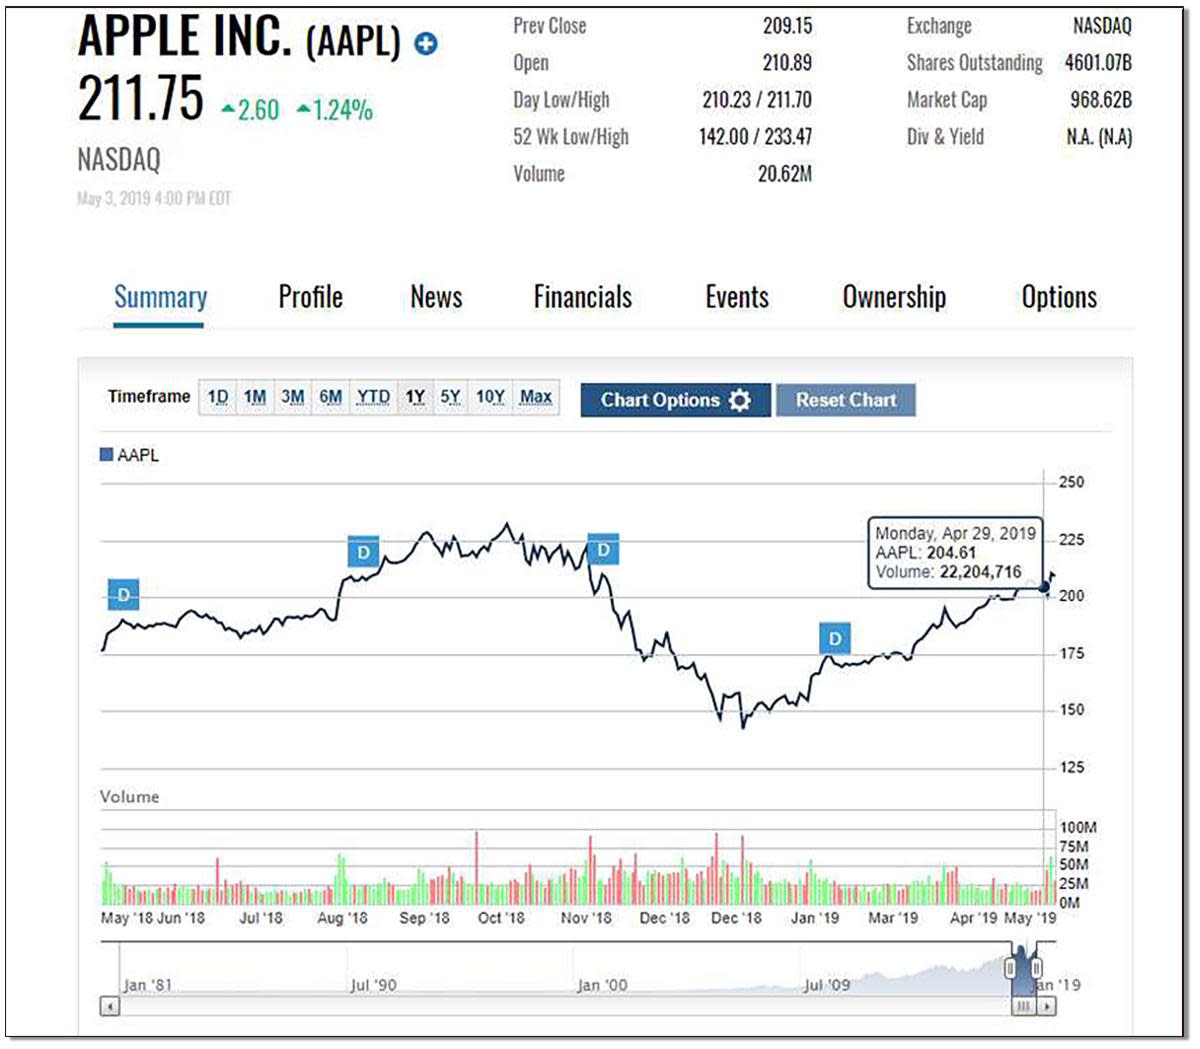
Every stock listed on an exchange comes with a set of metrics that tell a story about its current state and perceived value. The most immediate is the stock price, which reflects the last traded price and is subject to constant change based on supply and demand. However, the price alone is often insufficient. Volume – the number of shares traded over a specific period – is a crucial companion. High volume often confirms price movements, indicating strong conviction among buyers or sellers. A significant price move on low volume might be less reliable.
Beyond these, several fundamental metrics provide deeper insights. Market capitalization (Market Cap), calculated by multiplying the stock price by the number of outstanding shares, indicates the company’s total market value. This helps categorize companies as small-cap, mid-cap, or large-cap, each with distinct risk-reward profiles. The Price-to-Earnings (P/E) Ratio is another widely used valuation metric, comparing a company’s current share price to its per-share earnings. A high P/E might suggest investors expect high future growth, while a low P/E could indicate undervaluation or a lack of growth prospects. Other vital metrics include Dividend Yield, Earnings Per Share (EPS), and Book Value Per Share, all of which contribute to a holistic view of a company’s financial standing and investment appeal.
Interpreting Market Indices and Sector Performance
Individual stock prices don’t operate in a vacuum; they are influenced by broader market trends. Market indices act as barometers for specific segments of the market or the economy as a whole. The S&P 500, for instance, tracks 500 of the largest U.S. publicly traded companies, widely considered a benchmark for the overall U.S. stock market. The Dow Jones Industrial Average (DJIA) monitors 30 large, publicly traded companies, representing various industries. The NASDAQ Composite is heavily weighted towards technology and growth companies. Understanding how these indices are performing provides context for individual stock movements. If the broader market is declining, even fundamentally sound companies might see their stock prices fall.
Furthermore, analyzing sector performance is crucial. The stock market is typically divided into sectors like Technology, Healthcare, Financials, Energy, and Consumer Staples. Economic cycles and prevailing trends often favor certain sectors over others. For example, during periods of economic expansion, cyclical sectors like technology and industrials might outperform, while defensive sectors like utilities and consumer staples might be more resilient during downturns. Monitoring sector-specific news and performance can help identify areas of opportunity or risk.
The Pillars of Investment Analysis: Fundamental vs. Technical
To truly read the stock market, investors typically employ one or both of two primary analytical approaches: fundamental analysis and technical analysis. While seemingly disparate, they often provide complementary insights.
Mastering Fundamental Analysis: The Company’s Story
Fundamental analysis focuses on a company’s intrinsic value by examining its financial statements, management quality, competitive landscape, industry outlook, and macroeconomic factors. The core belief is that a stock’s market price will eventually reflect its true underlying value.
At its heart lies the meticulous review of financial statements. The Income Statement (or Profit & Loss Statement) reveals a company’s revenues, expenses, and net profit over a period. The Balance Sheet provides a snapshot of assets, liabilities, and equity at a specific point in time, indicating financial health and solvency. The Cash Flow Statement tracks how cash is generated and used, offering insights into liquidity and operational efficiency. By scrutinizing trends in these statements – looking for consistent revenue growth, improving profit margins, manageable debt levels, and strong cash generation – investors can gauge a company’s operational strength and growth potential.
Beyond the numbers, fundamental analysis also considers qualitative factors. Management quality and corporate governance are paramount; experienced, ethical leadership can steer a company through challenges. The competitive landscape dictates a company’s pricing power and market share. Understanding industry trends – whether an industry is growing, maturing, or declining – provides context for a company’s future prospects. Finally, macroeconomic indicators like GDP growth, inflation rates, interest rate policies, and unemployment figures can profoundly impact consumer spending, corporate profits, and investor confidence, thereby influencing the broader market and individual stock valuations.
Demystifying Technical Analysis: The Market’s Psychology
In contrast to fundamental analysis, technical analysis focuses solely on historical price and volume data to predict future price movements. Technicians believe that all relevant information is already discounted into a stock’s price, and that patterns in price movements tend to repeat due to consistent investor psychology.
The cornerstone of technical analysis is charting. Various chart types, such as candlestick charts, line charts, and bar charts, visually represent price action over time. Traders look for chart patterns like head and shoulders, double tops/bottoms, triangles, and flags, which are believed to signal potential reversals or continuations of trends. Identifying support and resistance levels is also critical; support is a price level where buying interest is strong enough to prevent the price from falling further, while resistance is a level where selling interest is strong enough to halt an ascent.

Technical indicators are mathematical calculations based on price and/or volume that help identify trends, momentum, volatility, and overbought/oversold conditions. Moving Averages (MAs) smooth out price data to identify trend direction; a short-term MA crossing above a long-term MA often signals an uptrend. The Relative Strength Index (RSI) measures the speed and change of price movements, indicating whether a stock is overbought (above 70) or oversold (below 30). The Moving Average Convergence Divergence (MACD) is a momentum indicator that shows the relationship between two moving averages of a security’s price. These indicators, when used in conjunction, can provide entry and exit signals, though none are foolproof. The role of volume in technical analysis cannot be overstated; significant price moves accompanied by high volume are generally considered more reliable than those on low volume.
Decoding Market Sentiment and Economic Influence
Beyond company-specific and technical data, understanding the broader forces of market sentiment and the economy is crucial for a complete market reading. The stock market is not just about numbers; it’s also about human psychology and the collective response to unfolding events.
The Power of News and Economic Releases
Financial markets are exceptionally sensitive to news and economic releases. Major announcements from central banks (e.g., interest rate decisions from the Federal Reserve), government reports (e.g., inflation data, unemployment rates, GDP figures), and corporate earnings reports can trigger immediate and significant price movements. Unexpected news, whether positive or negative, often leads to volatility as investors re-evaluate their positions.
It’s not just the news itself, but also the market’s interpretation and reaction to it. Sometimes, “good news” might lead to a sell-off if it’s already priced into the market or if investors had expected even better news. Conversely, “bad news” might be met with muted reactions if the market had anticipated worse. Learning to filter the noise and focus on credible, impactful information from reliable sources is a key skill. Regularly checking economic calendars and understanding the potential implications of upcoming releases can help investors anticipate market shifts.
Investor Psychology and Market Sentiment
The stock market is a reflection of collective human behavior, making investor psychology a powerful, albeit intangible, force. Market sentiment refers to the overall attitude of investors towards a particular security or financial market. When sentiment is bullish, investors are optimistic, leading to buying pressure and rising prices. When it’s bearish, pessimism prevails, resulting in selling pressure and falling prices. Periods of extreme optimism (greed) or pessimism (fear) can lead to market bubbles or crashes, respectively.
Understanding common cognitive biases that influence investment decisions is essential. These include confirmation bias (seeking information that confirms existing beliefs), herd mentality (following the crowd), and loss aversion (the tendency to prefer avoiding losses over acquiring equivalent gains). Recognizing these biases in oneself and in the broader market can help in making more rational decisions. Social media, financial news outlets, and investor forums can amplify sentiment, creating momentum that can temporarily override fundamental valuations. Being aware of this collective emotional ebb and flow allows investors to potentially identify irrational exuberance or undue panic.
Crafting Your Integrated Market Reading Strategy
Successfully reading the stock market is rarely about relying on a single indicator or method. It’s an ongoing process of integrating diverse information, continuous learning, and disciplined application.
The Synergy of Combined Approaches
The most effective market readers often adopt a hybrid approach, combining elements of both fundamental and technical analysis. Fundamental analysis helps identify what to buy (strong companies at attractive valuations), while technical analysis helps determine when to buy and sell (optimal entry and exit points). For instance, an investor might use fundamental analysis to screen for companies with robust financials and compelling growth prospects, and then turn to technical analysis to pinpoint an opportune moment to enter the trade, perhaps after a consolidation phase or a clear breakout from a resistance level. This synergy provides a more comprehensive perspective, allowing investors to capitalize on both intrinsic value and market momentum.
The Imperative of Continuous Learning and Adaptation
The stock market is a dynamic entity, constantly evolving with new technologies, economic shifts, and global events. What worked yesterday may not work tomorrow. Therefore, continuous learning is not merely an advantage but a necessity. This involves staying updated on economic trends, global geopolitics, technological advancements, and regulatory changes. Reading financial literature, following reputable analysts, and learning from one’s own successes and mistakes are all part of this ongoing education.
Equally important is adaptation. Successful investors are flexible, willing to adjust their strategies and assumptions when market conditions change. Holding rigidly to a pre-conceived notion in the face of contradictory evidence can be detrimental. Regularly reviewing your investment thesis, reassessing company fundamentals, and re-evaluating technical patterns ensures your strategy remains relevant and effective.
Risk Management and Portfolio Diversification
No matter how adept one becomes at reading the stock market, risk management remains paramount. Every investment carries some degree of risk, and even the most seasoned investors face losses. A key component of risk management is diversification – spreading investments across different asset classes, industries, and geographies to reduce the impact of any single poor-performing asset. While diversification doesn’t guarantee profits or protect against losses, it significantly mitigates unsystematic risk.
Additionally, understanding your personal risk tolerance and setting clear investment goals are crucial. This guides your asset allocation decisions and prevents emotional reactions during market volatility. Implementing strategies like stop-loss orders, proper position sizing, and maintaining a cash reserve can further protect capital and provide opportunities during market downturns.
In conclusion, reading the stock market is a multi-faceted skill that blends quantitative analysis with an understanding of human behavior and macroeconomic forces. It requires patience, discipline, and a commitment to lifelong learning. By mastering the language of market data, employing both fundamental and technical analysis, understanding market sentiment, and applying sound risk management principles, investors can navigate the complexities of the stock market with greater confidence and make more informed decisions on their path to financial well-being.
aViewFromTheCave is a participant in the Amazon Services LLC Associates Program, an affiliate advertising program designed to provide a means for sites to earn advertising fees by advertising and linking to Amazon.com. Amazon, the Amazon logo, AmazonSupply, and the AmazonSupply logo are trademarks of Amazon.com, Inc. or its affiliates. As an Amazon Associate we earn affiliate commissions from qualifying purchases.