
The modern e-commerce landscape is a marvel of algorithmic efficiency, but for the average consumer, it can feel like a labyrinth of fluctuating numbers. Amazon, the titan of the industry, utilizes dynamic pricing models that can change the cost of a single product dozens of times within a twenty-four-hour window. For the tech-savvy consumer, understanding these shifts isn’t just about saving a few dollars; it is about mastering the data-driven environment of the digital age.
To “see” Amazon price history is to pull back the curtain on the complex software and data scrapers that power the world’s largest marketplace. By leveraging specific browser extensions, web-based tools, and data analytics platforms, users can transform from passive observers into informed participants. This guide explores the technical infrastructure of price tracking and provides a comprehensive tutorial on the tools necessary to decode Amazon’s pricing logic.

The Mechanics of Dynamic Pricing and Data Aggregation
Before diving into the tools, it is essential to understand the technical “why” behind price fluctuations. Amazon does not set prices in a vacuum. Instead, its infrastructure relies on a sophisticated pricing engine—an AI-driven system that monitors competitor prices, inventory levels, historical demand, and even the time of day.
Algorithm-Driven Fluctuations
Amazon’s pricing algorithm is one of the most advanced examples of machine learning in the retail sector. It processes millions of data points every second to ensure that the platform remains competitive against retailers like Walmart and Target. This results in “micro-fluctuations.” A product might drop by $0.05 to trigger a “lowest price” badge in a search engine, only to rise by $5.00 once the inventory of a competitor is depleted. For the user, this means the price you see at 10:00 AM might be fundamentally different from the one displayed at 10:00 PM.
The Role of Third-Party Data Scrapers
Because Amazon does not provide a native “price history” chart to its users, the tech community has developed third-party solutions. These tools rely on “web scraping” or “web crawling.” High-frequency scripts visit millions of Amazon product pages daily, recording the price and storing it in a massive database. When you use a price history tool, you are essentially querying a private database that has been meticulously cataloged by these external bots. Understanding this technical back-end helps users realize why some niche products might have “gaps” in their data history—if a bot hasn’t visited that specific URL recently, the data point doesn’t exist.
Essential Tech Tools for Price Tracking
To gain visibility into these price trends, users must integrate specific software into their browsing workflow. The choice of tool often depends on whether you prefer a “set and forget” automation style or a deep-dive data analysis approach.
Browser Extensions: Keepa and CamelCamelCamel
The most efficient way to see price history is through browser extensions (available for Chrome, Firefox, Safari, and Edge). These tools inject a graphical interface directly onto the Amazon product page, usually just below the product image.
- Keepa: Widely considered the “gold standard” for power users, Keepa provides a highly detailed chart. It tracks not only the Amazon price but also the “Third Party New” and “Used” prices. It even tracks the “Warehouse Deal” prices.
- CamelCamelCamel (The Camelizer): This is a more streamlined tool focused on user accessibility. Its extension, “The Camelizer,” allows you to view history charts without leaving the tab. It is particularly useful for those who want a clean, high-level overview of the “Highest,” “Lowest,” and “Average” prices over a 1-year or 3-month duration.
Web-Based Dashboards and APIs
For those who do not wish to install extensions due to privacy or performance concerns, web-based dashboards are the alternative. Sites like Earny or the web versions of CamelCamelCamel allow you to paste an Amazon URL into their search bar to retrieve the historical data.
Furthermore, for developers or data analysts, some of these services offer APIs. These Application Programming Interfaces allow you to pull price data into your own custom software or spreadsheets, enabling you to build personal notification systems or large-scale market research tools. This is a common practice for tech enthusiasts who want to automate their shopping during high-traffic events like Prime Day or Black Friday.
Mobile App Integrations
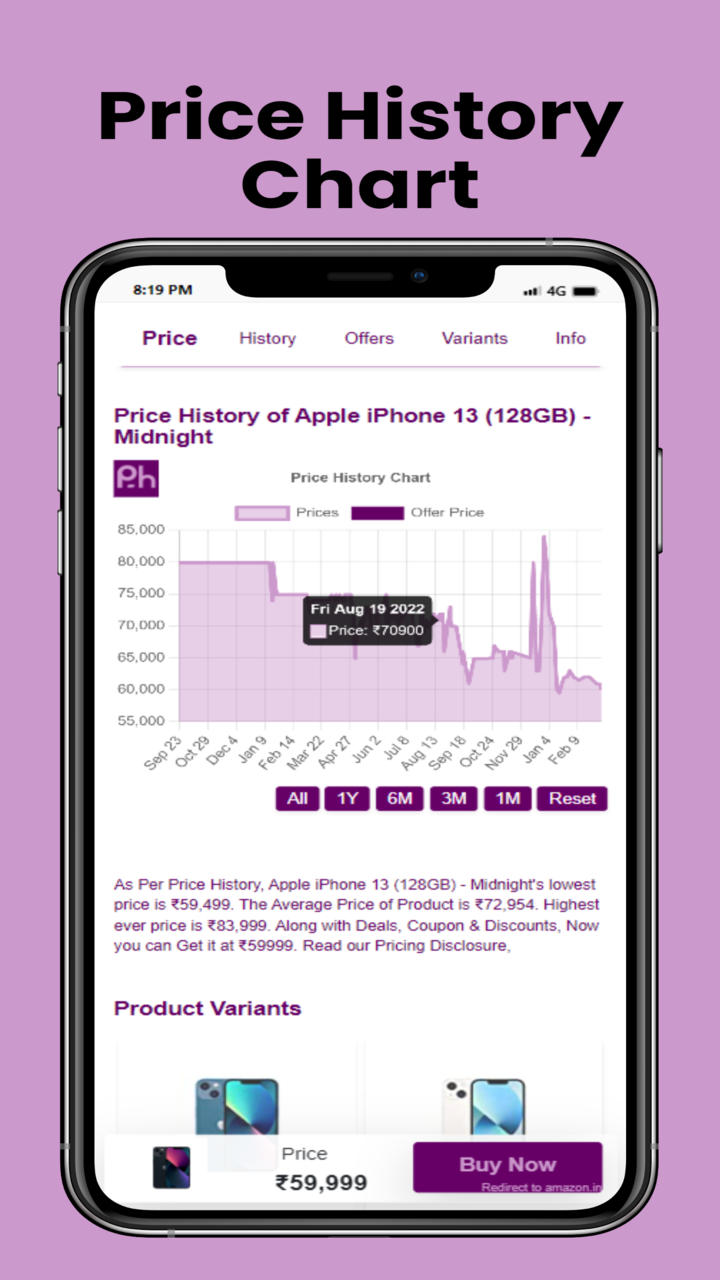
While mobile browsers are more restrictive regarding extensions, dedicated apps have filled the gap. Many price tracking services offer iOS and Android applications. These apps often utilize “Share Sheet” integrations, allowing you to send an Amazon product link directly to the tracker app to view its historical trajectory.
Technical Deep Dive: Navigating the Data Visualizations
Simply seeing a graph is one thing; interpreting the data points is another. To truly master Amazon price history, you must understand how to read the technical nuances of the charts provided by tools like Keepa.
Visualizing Data through Graphs
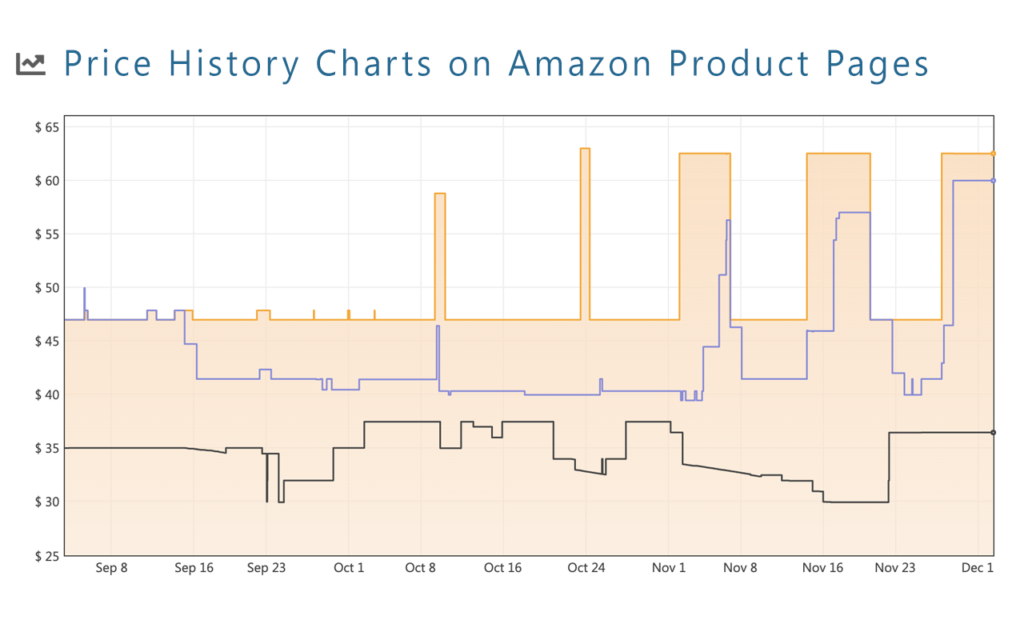
When looking at a Keepa or CamelCamelCamel chart, you are usually looking at a multi-axis line graph.
- The X-Axis: Represents time (ranging from a single day to the lifetime of the product).
- The Y-Axis: Represents the price in the local currency.
- The “Amazon” Line: Usually represented in orange, this tracks items sold and shipped by Amazon itself.
- The “Marketplace” Line: Usually blue or purple, this tracks third-party sellers.
A “sawtooth” pattern—where the price drops sharply and then slowly rises—often indicates a recurring sale cycle. Conversely, a flat line followed by a sudden spike might indicate a supply chain shortage or the end of a manufacturer’s promotional period.
Setting Up Automated Webhooks and Notifications
The true power of these tech tools lies in automation. Rather than manually checking a chart every day, you can set “Price Watches.”
- Threshold Alerts: You can instruct the software to send an email, a browser push notification, or even a Telegram message when a product hits a specific price point (e.g., “Notify me when this SSD drops below $100”).
- The “Deal” Feed: Advanced users often use RSS feeds or webhooks to integrate price drops into productivity apps like Slack or Discord. This ensures that you are notified the millisecond the database updates, allowing you to bypass the “out of stock” issues that plague popular items.
Advanced Strategies for the Tech-Savvy Shopper
Once you are comfortable with the basic tracking tools, you can employ more advanced technical strategies to ensure you are getting the absolute best value based on historical data.
Cross-Referencing Regional Data
Amazon operates across multiple international domains (.com, .co.uk, .de, .ca, etc.). Often, a product might be significantly cheaper on the German site (Amazon.de) than on the US site (Amazon.com), even after international shipping. Advanced extensions like Keepa allow you to overlay international prices on a single chart. This gives you a global perspective on the product’s value, identifying whether your local price is an outlier.
Understanding Lightning Deal and “Used” Patterns
Digital price tracking isn’t limited to “New” items. One of the most effective tech-hacks for saving money is tracking the “Amazon Warehouse” (Used – Like New) price history. These items are often returns that are functionally perfect but sold at a steep discount. By tracking the delta (the difference) between the New price and the Warehouse price, you can identify the optimal time to buy a “re-certified” tech gadget.
Additionally, historical data can reveal the frequency of “Lightning Deals.” If a mechanical keyboard goes on a Lightning Deal every 45 days like clockwork, and it has been 40 days since the last one, the data suggests you should wait five more days rather than buying at the current MSRP.
The Future of E-commerce Transparency and AI
As we look forward, the technology used to track price history is evolving from reactive to predictive. We are entering an era where consumers won’t just see where the price was, but where it is going.
Machine Learning in Predictive Pricing
Newer startups are beginning to integrate predictive AI models into their price tracking software. By analyzing years of historical data, seasonal trends, and current inflation rates, these tools can offer a “Price Prediction” score. This score might advise a user: “There is an 85% chance this price will drop in the next 14 days.” This moves the user from a position of historical analysis to one of strategic foresight.
Digital Security, Privacy, and Data Ethics
As with any software that “reads” your browser data, security is a paramount concern. When choosing a price history extension, it is vital to audit the permissions. Does the extension require access to “all website data” or only “Amazon.com”? Tech-conscious users should opt for tools with a proven track record of data privacy and transparent business models (often supported by affiliate commissions rather than selling user browsing data).
The ability to see Amazon price history is a vital skill in the toolkit of the modern digital citizen. By utilizing scrapers, extensions, and automated notification systems, you strip away the opacity of dynamic pricing. This technical approach to shopping ensures that your decisions are based on hard data rather than the psychological triggers of “limited time offers” or artificial scarcity. In the digital marketplace, information is the ultimate currency, and price history is the map that helps you navigate it.
aViewFromTheCave is a participant in the Amazon Services LLC Associates Program, an affiliate advertising program designed to provide a means for sites to earn advertising fees by advertising and linking to Amazon.com. Amazon, the Amazon logo, AmazonSupply, and the AmazonSupply logo are trademarks of Amazon.com, Inc. or its affiliates. As an Amazon Associate we earn affiliate commissions from qualifying purchases.