
In the evolution of educational technology, few tools have bridged the gap between complex mathematical theory and intuitive visual representation as effectively as Desmos. Founded with the mission to help every student learn math and love learning math, Desmos has transitioned from a simple browser-based calculator into a powerhouse suite of mathematical tools used by millions of students, educators, and engineers worldwide. Unlike the bulky, expensive handheld graphing calculators of the past, Desmos offers a high-performance, accessible, and aesthetically pleasing interface that runs on any device with an internet connection.
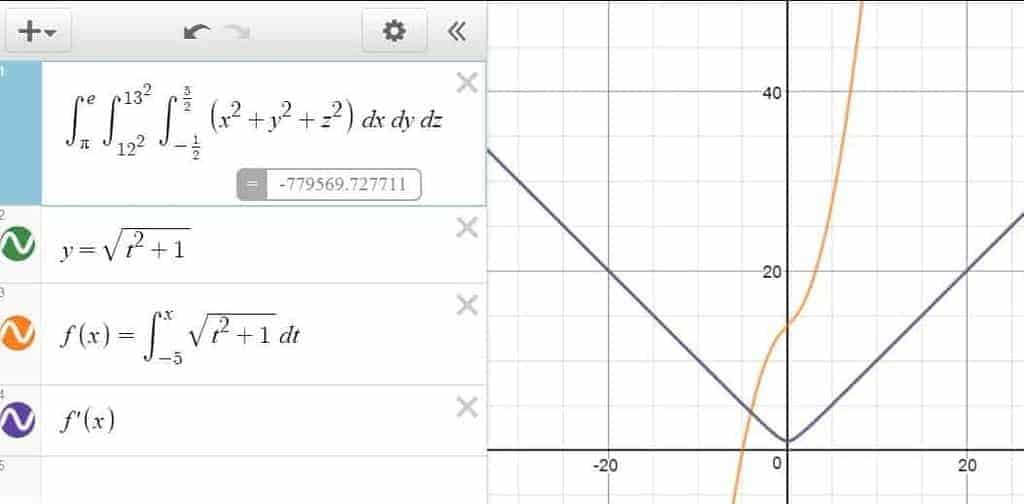
This guide explores the technical depth of Desmos, providing a roadmap for users to move from basic plotting to advanced data visualization and interactive classroom engagement.
Getting Started with the Desmos Interface
The beauty of Desmos lies in its minimalist design. When you first open the graphing calculator, you are presented with a clean slate: a Cartesian plane on the right and an expression list on the left. Understanding how to navigate this workspace is the first step toward mastering the software.
The Expression List and Virtual Keypad
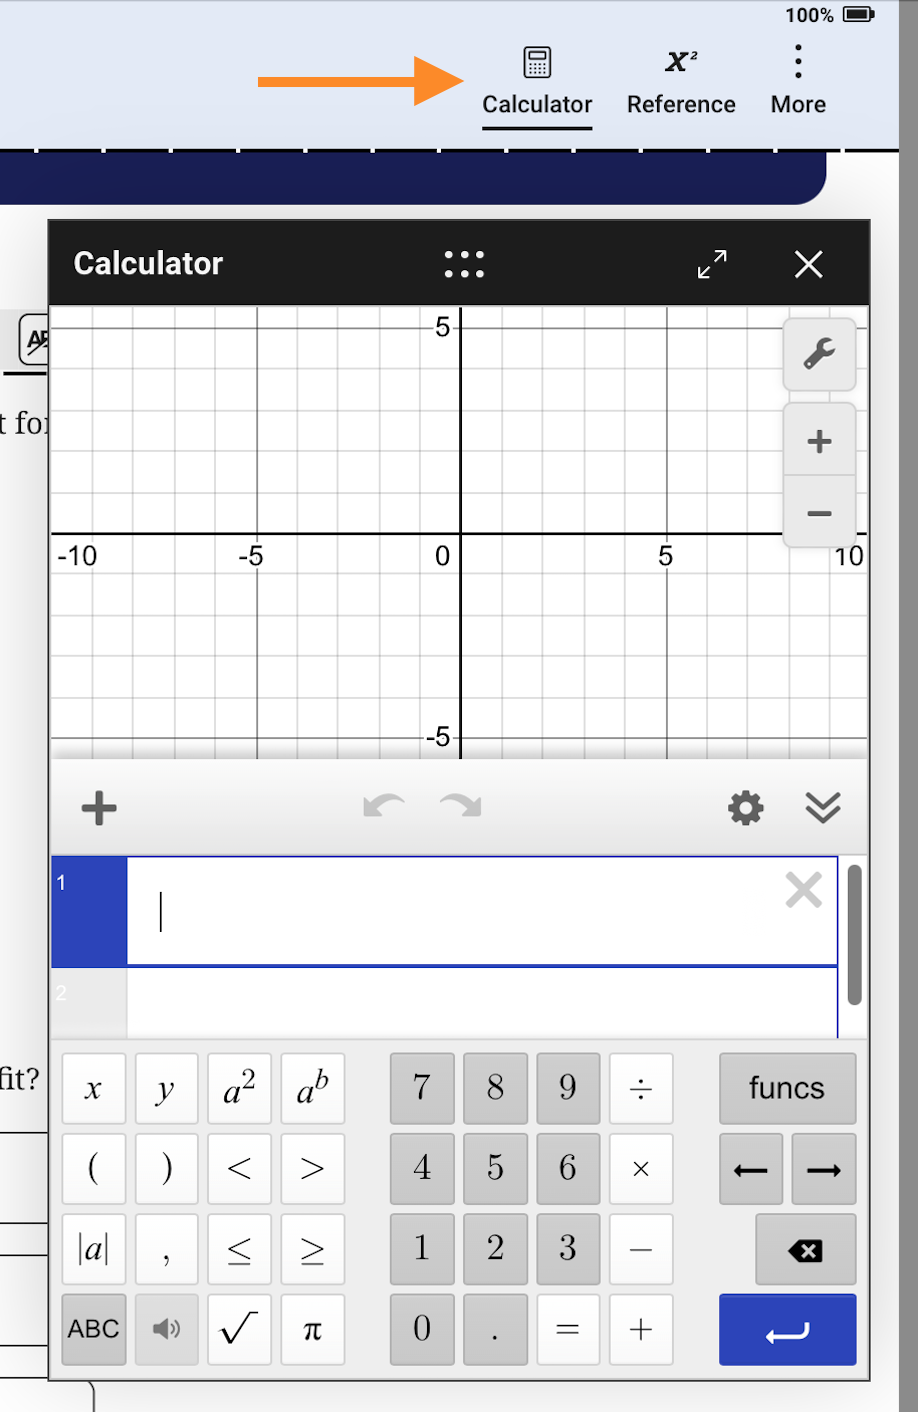
The expression list is the command center of Desmos. Every equation, variable, and function you input appears here. Desmos uses a “What You See Is What You Get” (WYSIWYG) editor, meaning that as you type x^2, the software instantly renders it as a superscript. For users who prefer a tactile experience or are using touch-screen devices, the built-in virtual keypad provides quick access to square roots, pi, trigonometric functions, and inequalities.
One of the most powerful technical features of the expression list is its ability to handle “Implicit Equations.” While traditional calculators often require you to solve for y (e.g., y = 2x + 3), Desmos allows you to type equations in any form, such as x^2 + y^2 = 25, which instantly renders a perfect circle. This flexibility reduces the cognitive load on the user, allowing them to focus on the mathematical relationships rather than algebraic manipulation.
Navigation and View Settings
The graph paper itself is highly customizable. Using a mouse or trackpad, you can click and drag to pan across the infinite plane. The scroll wheel allows for seamless zooming. However, for precise technical work, the “Graph Settings” (represented by the wrench icon) is essential. Here, you can toggle between Cartesian and Polar grids, switch to “Reverse Contrast” for better visibility in dark environments, and manually set the bounds for the X and Y axes. You can also switch between Degrees and Radians, a crucial setting for anyone working with trigonometric functions.
Advanced Graphing Techniques and Data Visualization
Once you are comfortable with basic plotting, Desmos reveals its depth through dynamic variables and statistical tools. These features transform a static image into a living mathematical model.
Using Sliders for Dynamic Exploration
Sliders are perhaps the most iconic feature of Desmos. If you type an equation with an undefined variable, such as y = mx + b, Desmos will ask if you want to “add sliders.” Clicking “all” creates interactive bars for m (slope) and b (y-intercept).
By dragging these sliders, you can observe in real-time how changing a value transforms the graph. This is not just a visual gimmick; it is a powerful tool for sensitivity analysis and understanding parameterization. Technically, sliders can be configured with specific bounds and step increments, or even set to “play” on a loop, effectively animating the graph to demonstrate concepts like wave frequency or projectile motion.
Working with Tables and Regressions
For data scientists and students working with real-world data, Desmos provides a robust “Table” feature. You can import data by pasting it from a spreadsheet or entering it manually. Once the data points are plotted, Desmos can perform complex regressions.
To find a line of best fit, you use the tilde (~) symbol. For example, typing y1 ~ mx1 + b tells Desmos to calculate the values of m and b that best fit the data in your table. The software provides the R-squared value and residuals, giving users immediate feedback on the accuracy of their model. This functionality rivals high-end statistical software while remaining accessible to a novice user.

Restricting Domains and Creating Art
A unique subculture has emerged around “Desmos Art,” where users create intricate portraits and landscapes using nothing but mathematical equations. This is made possible through domain and range restrictions. By adding curly braces to an equation, such as y = x {x < 2}, you tell the software to only render the line where x is less than 2.
Using these constraints, creators can layer hundreds of functions—circles for eyes, parabolas for smiles, and shaded inequalities for color—to build complex digital illustrations. This intersection of math and art highlights the software’s precision and the fluidity of its rendering engine.
Leveraging Desmos for Collaborative Education
While the graphing calculator is a solo tool, the Desmos ecosystem includes a comprehensive platform for educators known as the Teacher Dashboard. This suite is designed to facilitate synchronous and asynchronous digital learning.
The Desmos Teacher Dashboard
The Teacher Dashboard allows educators to create “Activities”—sequences of screens that guide students through mathematical discoveries. As students work through the problems on their own devices, the teacher sees a real-time “Bird’s Eye View” of the entire class’s progress.
Technical features like the “Anonymizer” allow teachers to display student work on a projector without revealing names, fostering a safe environment for discussing mistakes. The “Pacing” and “Pause” tools give the instructor control over the flow of the lesson, ensuring that the technology serves the pedagogy, rather than distracting from it.
Interactive Classroom Activities
Beyond simple graphing, Desmos has developed specialized activity types like “Marbleslides” and “Polygraphs.” Marbleslides challenge students to transform graphs so that falling marbles hit specific targets, teaching them about function transformations through trial and error. Polygraph is a digital version of “Guess Who?” where students use mathematical vocabulary to identify a specific graph chosen by a classmate. These tools leverage the software’s interactivity to turn abstract concepts into tangible, gamified experiences.
Integrating Desmos into Professional and Scientific Workflows
Desmos is often categorized as a “student tool,” but its technical capabilities make it a viable asset for professionals in STEM fields who need quick, shareable visualizations without the overhead of MATLAB or Python.
Scientific and Matrix Calculators
In addition to the graphing calculator, Desmos offers a specialized Scientific Calculator and a Matrix Calculator. The Matrix Calculator is particularly impressive, allowing users to perform operations like finding determinants, inverses, and reduced row echelon form (RREF) on matrices up to 10×10. Its “fraction output” toggle is a favorite for engineers who need exact values rather than decimal approximations.
Exporting and Sharing Your Work
In a professional tech environment, the ability to share data is paramount. Desmos allows users to generate a unique URL for every graph, which saves the state of the expression list and the zoom level. These links can be embedded in digital textbooks or shared via Slack and Microsoft Teams. For those needing high-resolution images for publications or presentations, Desmos offers an “Export Image” feature with various thickness settings and formats (SVG, PNG), ensuring the math looks as sharp on paper as it does on the screen.
The Future of Digital Mathematics Tools
As we look toward the future of educational software, Desmos stands as a benchmark for accessibility and performance. It has pioneered web-based accessibility, offering screen-reader compatibility and Braille support (both Nemeth and UEB), ensuring that the visual nature of graphing does not exclude students with visual impairments.
The integration of Desmos into standardized testing—including the SAT, ACT, and various state exams—marks a permanent shift in how we approach mathematical literacy in the digital age. By removing the financial barrier of the $100 handheld calculator, Desmos has democratized high-level mathematics.
Whether you are a student visualizing your first linear equation, a teacher managing a classroom of thirty, or an engineer checking a complex regression, Desmos provides a seamless, powerful, and free solution. It is more than just a calculator; it is a digital canvas where the language of mathematics comes to life. By mastering its various tools—from simple sliders to complex regressions—users can unlock a deeper, more intuitive understanding of the world around them through the lens of technology.
aViewFromTheCave is a participant in the Amazon Services LLC Associates Program, an affiliate advertising program designed to provide a means for sites to earn advertising fees by advertising and linking to Amazon.com. Amazon, the Amazon logo, AmazonSupply, and the AmazonSupply logo are trademarks of Amazon.com, Inc. or its affiliates. As an Amazon Associate we earn affiliate commissions from qualifying purchases.