
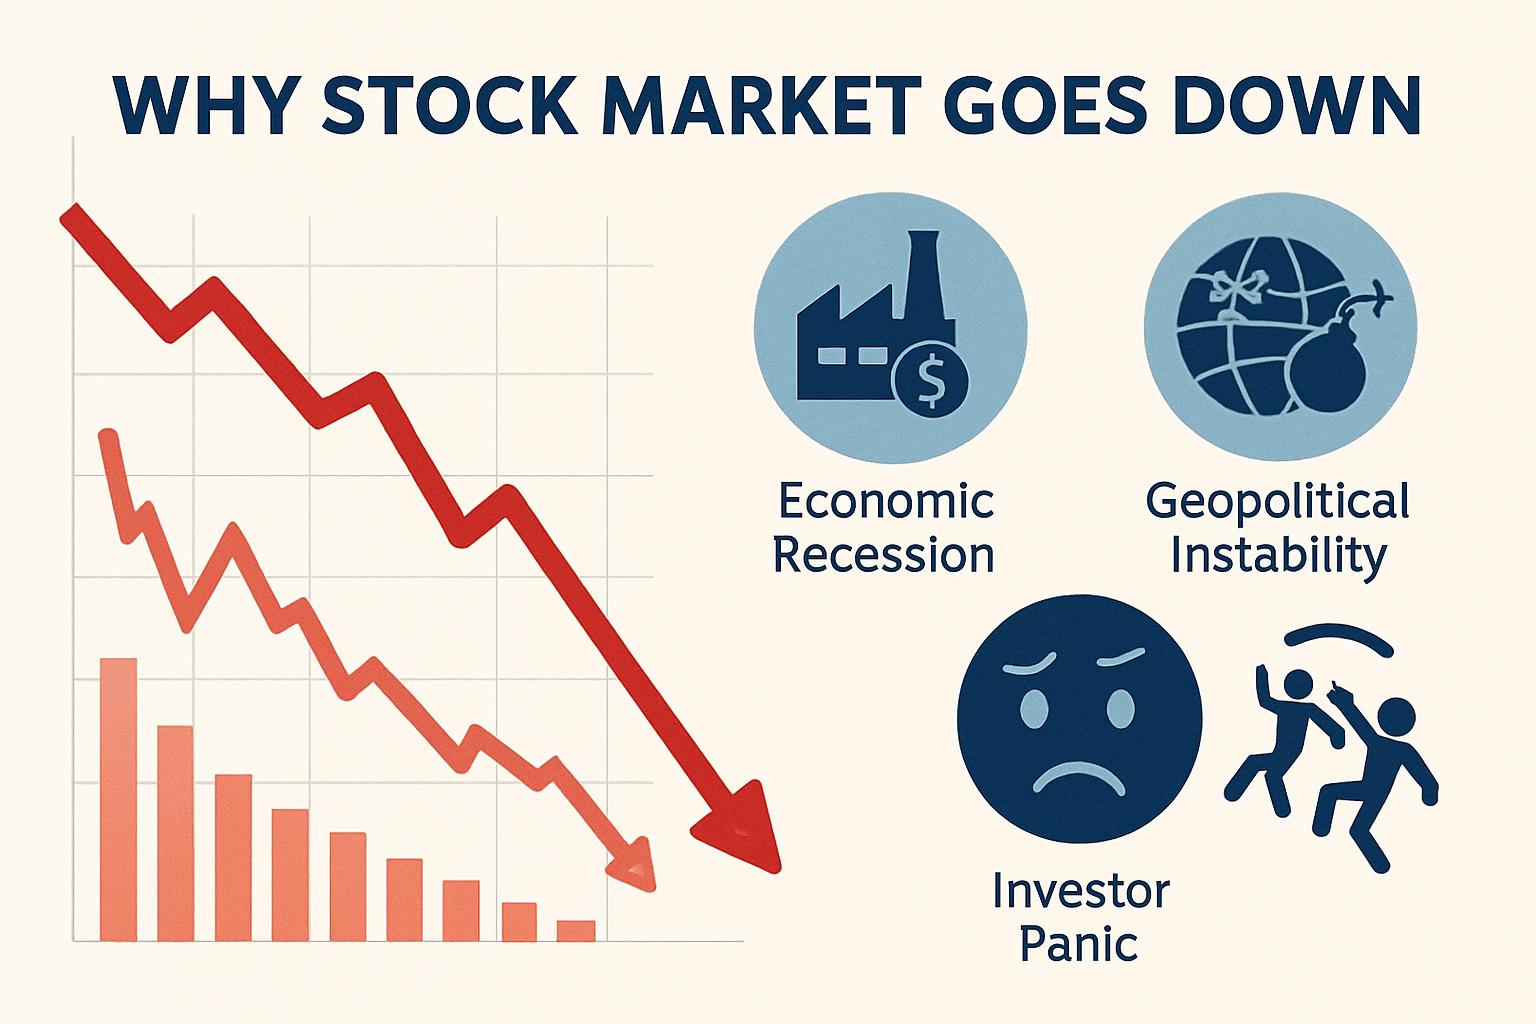
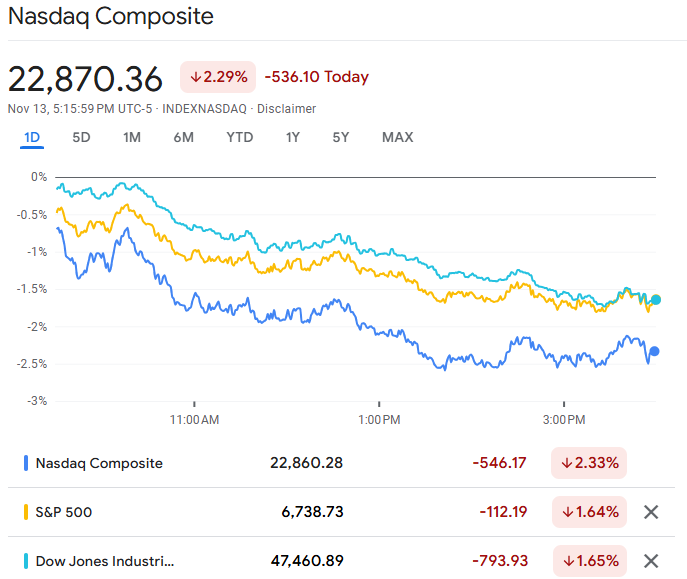
Watching the sea of red on a trading terminal or a finance app can be an unsettling experience for any investor. Whether you are a seasoned portfolio manager or a newcomer building a retirement nest egg, the question “Why did the market go down today?” is often the first thing that comes to mind when the major indices—the S&P 500, the Dow Jones Industrial Average, and the Nasdaq—stumble.
Market volatility is an inherent feature of capitalism, yet price drops rarely happen in a vacuum. They are usually the result of a complex interplay between macroeconomic data, corporate health, and human psychology. To understand why the market dipped today, we must look beyond the surface-level numbers and analyze the underlying catalysts that drive institutional and retail selling.
Macroeconomic Catalysts: The Role of Interest Rates and Inflation
The most significant driver of market movement in the modern era is the macroeconomic environment, specifically the policies dictated by central banks. When the market experiences a broad sell-off, the primary culprit is often a shift in expectations regarding the cost of money.
The Federal Reserve’s “Higher for Longer” Stance
The Federal Reserve, often referred to simply as “the Fed,” has a dual mandate: to promote maximum employment and stable prices. To combat inflation, the Fed adjusts the federal funds rate. When investors receive data suggesting that interest rates will remain high for a longer period than previously anticipated, the market typically reacts negatively.
High interest rates are a “gravity” for stock prices. They increase the cost of borrowing for companies, which eats into profit margins. Furthermore, higher rates increase the discount rate used in financial models to value future cash flows. For high-growth companies, particularly in the technology sector, this leads to a sharp reduction in current valuation, triggering a sell-off.
Inflation Data and Consumer Price Index (CPI) Revisions
Inflation is the silent enemy of equity markets. When the Consumer Price Index (CPI) or the Producer Price Index (PPI) comes in higher than economist forecasts, it signals that the economy is “overheating.” This puts pressure on the Fed to hike rates or delay planned rate cuts.
Today’s market decline could be a direct reaction to a “hot” inflation report. If prices for energy, housing, or services remain sticky, investors begin to price in a more hawkish central bank. Additionally, high inflation erodes the purchasing power of consumers; if people are spending more on gas and groceries, they have less to spend on the discretionary products and services offered by the companies listed on the stock exchange.
Corporate Performance and Earnings Season Volatility
While macroeconomics sets the stage, individual corporate performance provides the script. We are often in or approaching “earnings season,” a period when publicly traded companies report their quarterly financial results. These reports are major volatility catalysts.
Missed Guidance and the “Whisper Number”
Sometimes a company reports record-breaking profits and revenue, yet its stock price—and the broader sector—falls. This happens because the market is forward-looking. If a company meets its current goals but issues “weak guidance” (predicting slower growth in the next quarter), investors will sell.
The market also operates on “whisper numbers”—unofficial expectations held by analysts that are higher than the published estimates. If a flagship company like Apple, Microsoft, or Nvidia fails to exceed these elevated expectations, it can drag down the entire index. A sell-off in a few “mega-cap” stocks can account for a significant percentage of an index’s decline due to their heavy weighting.
Sector-Specific Slumps: Tech vs. Energy
Market downturns are not always uniform. Today’s decline might be concentrated in a specific sector that is facing headwinds. For instance, a sudden drop in the price of crude oil might cause the Energy sector to plummet, while a regulatory crackdown on data privacy could hit the Communication Services and Tech sectors.
When a leading company in a sector provides a negative outlook, it creates a “contagion” effect. If a major retailer reports a slowdown in consumer spending, investors assume that all retailers are facing the same struggle, leading to a sector-wide retreat that pulls the overall market lower.
Geopolitical Tensions and Global Supply Chain Disruptions
The stock market hates uncertainty, and nothing creates uncertainty like geopolitical instability. In a globalized economy, an event on the other side of the world can have an immediate impact on a portfolio in New York or London.
Regional Conflicts and Energy Prices
Geopolitical tensions in oil-producing regions often lead to a “risk-off” sentiment. When conflict arises, the immediate fear is a disruption in the global energy supply. Rising oil prices act as a tax on both businesses and consumers, increasing shipping costs and manufacturing expenses.
If the market is down today, it may be because of escalating rhetoric between world powers or physical disruptions in trade routes. Investors respond to these threats by selling “risky” assets like stocks and moving into “safe havens” like gold or government bonds.
Trade Policy and Tariffs
Changes in trade policy can also trigger a market dip. If a major economy announces new tariffs or trade restrictions, it threatens the profitability of multinational corporations. Supply chains are finely tuned; any interruption in the flow of components—such as semiconductors or raw materials—can lead to production delays and increased costs. The market reflects these systemic risks almost instantly, as traders’ price in the long-term impact on corporate earnings.
Technical Indicators and Investor Psychology
Not every market move is based on “hard” news. Sometimes, the reason the market went down today is rooted in the mechanics of trading and the collective psyche of the investing public.
Profit Taking and Resistance Levels
After a period of strong gains, it is natural for the market to take a “breather.” Institutional investors and algorithmic trading bots often have pre-set price targets. When the S&P 500 or a specific stock reaches a “resistance level”—a historical price point where selling pressure typically increases—a wave of profit-taking can occur.
This selling can be self-reinforcing. As the price drops, “stop-loss” orders are triggered, which automatically sell shares to prevent further losses. This creates a cascade of selling volume that can turn a minor dip into a significant intraday decline, even in the absence of negative news.
The Fear and Greed Index: Understanding Sentiment
Investor sentiment often swings between two extremes: greed and fear. When the market has been “overbought,” meaning prices have risen too far and too fast, the slightest bit of negative news can cause a disproportionate amount of fear.
The “VIX,” often called the “Fear Gauge,” measures expected volatility. If the VIX spikes, it indicates that investors are buying insurance against a market drop, which often coincides with a falling market. Today’s decline might simply be the “fear” side of the pendulum swinging back after a period of irrational exuberance.
Navigating the Downturn: Strategies for Long-Term Investors
Understanding why the market went down today is only half the battle; the other half is knowing how to respond. For the disciplined investor, a red day is not a signal to panic, but an opportunity to evaluate their financial strategy.
Dollar-Cost Averaging During Volatility
One of the most effective ways to handle a down market is through dollar-cost averaging (DCA). By investing a fixed amount of money at regular intervals, regardless of the price, you naturally buy more shares when prices are low and fewer shares when prices are high.
On days when the market is down, your fixed investment goes further. Over long periods, this strategy reduces the impact of volatility and lowers the average cost per share of your investments. Rather than trying to “time the bottom,” DCA focuses on “time in the market.”
Rebalancing Your Portfolio
A market downturn can also serve as a reminder to rebalance. If a specific sector—like tech—has grown to represent too large a portion of your portfolio, a pull-back is an opportunity to sell some of those winners and buy into undervalued areas like defensive stocks or bonds.
Rebalancing forces you to follow the most fundamental rule of investing: buy low and sell high. It ensures that your risk profile remains aligned with your long-term goals and that you aren’t overly exposed to a single market catalyst.

The Importance of a Long-Term Perspective
In the grand scheme of a 20 or 30-year investment horizon, a single day’s decline is rarely more than a blip on a chart. History shows that the stock market has an upward bias, driven by innovation, population growth, and corporate productivity.
While the question “Why did the market go down today?” is important for staying informed, it should not dictate your long-term investment thesis. Successful investing is often less about reacting to today’s news and more about having the emotional fortitude to stay the course when others are selling. By understanding the macro, corporate, and psychological factors at play, you can transform market volatility from a source of anxiety into a tool for long-term wealth creation.
aViewFromTheCave is a participant in the Amazon Services LLC Associates Program, an affiliate advertising program designed to provide a means for sites to earn advertising fees by advertising and linking to Amazon.com. Amazon, the Amazon logo, AmazonSupply, and the AmazonSupply logo are trademarks of Amazon.com, Inc. or its affiliates. As an Amazon Associate we earn affiliate commissions from qualifying purchases.