In the realm of personal and business finance, numbers are the primary language of progress. While growth is often the celebrated metric, understanding contraction—specifically how to work out a percentage decrease—is arguably more critical for long-term sustainability. Whether you are tracking a dip in your investment portfolio, analyzing a reduction in corporate overhead, or measuring the impact of a market correction, the ability to accurately quantify a decrease is a fundamental skill for any financially literate individual.
A percentage decrease represents the relative change between an initial value and a lower subsequent value, expressed as a fraction of 100. In financial terms, this metric provides context that raw numbers cannot. Losing $1,000 feels significant, but its impact is vastly different if it represents a 1% drop in a million-dollar portfolio versus a 50% drop in a small savings account.

The Core Mechanics of Calculating Percentage Decrease
Before applying these figures to complex financial strategies, one must master the basic formula. In the world of finance, precision is non-negotiable, and the logic remains consistent whether you are dealing with cents or billions.
The Standard Financial Formula
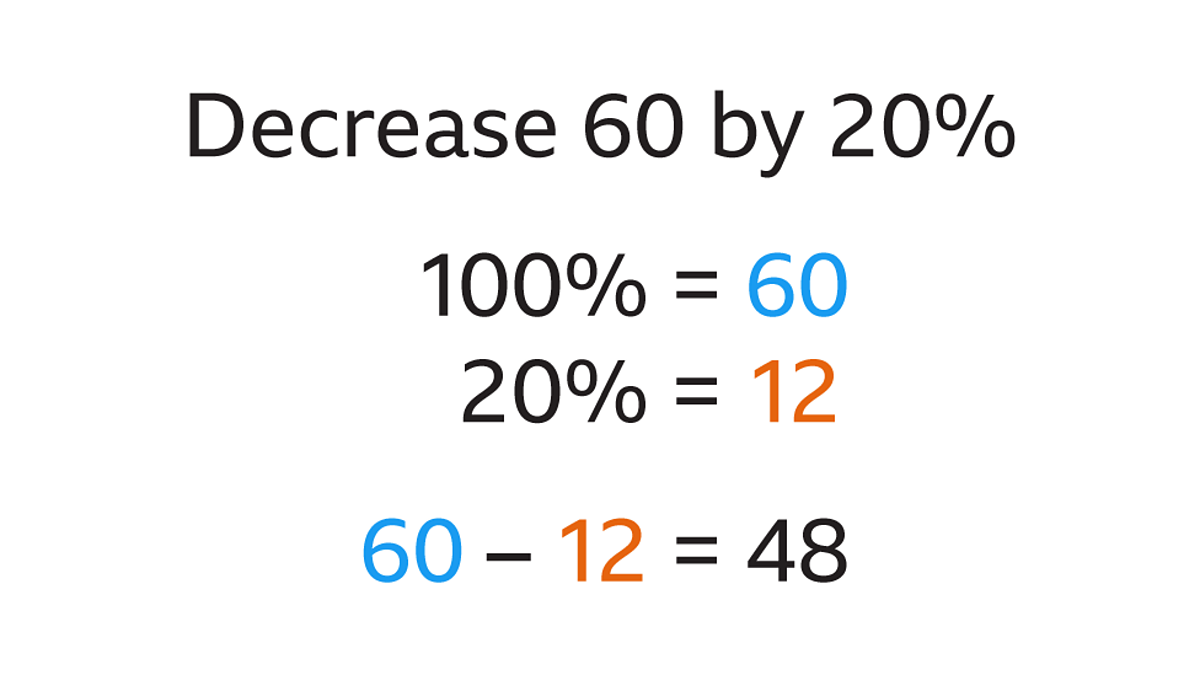
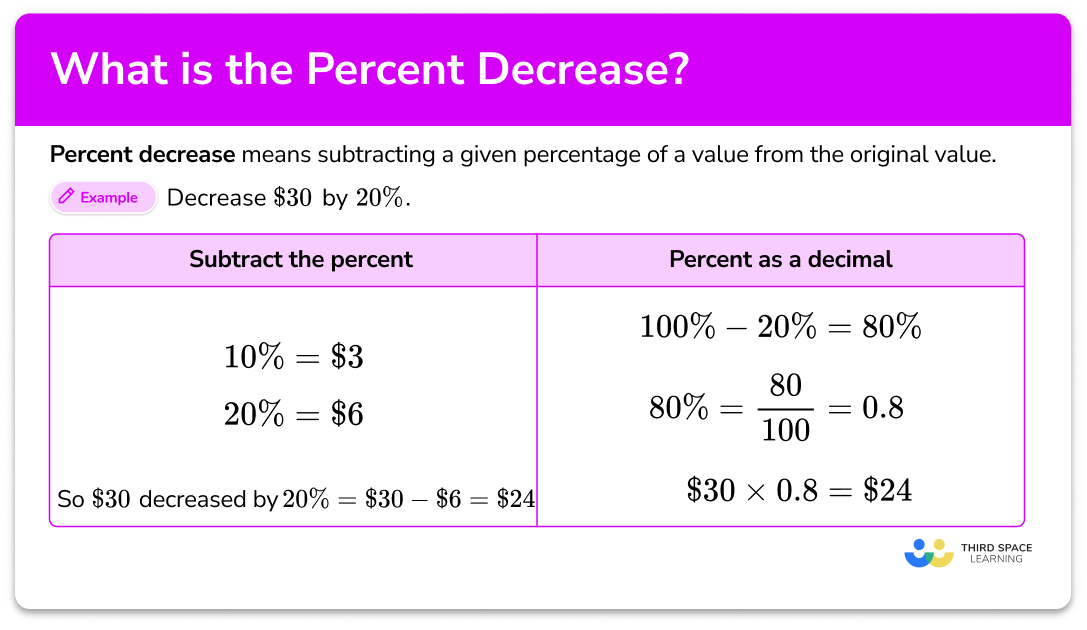
To calculate a percentage decrease, you follow a three-step logical process:
- Find the absolute difference: Subtract the new (lower) value from the original (higher) value.
- Divide by the origin: Divide that difference by the original value.
- Convert to a percentage: Multiply the resulting decimal by 100.
The formula looks like this:
((Original Value – New Value) / Original Value) * 100 = Percentage Decrease
Practical Application: The Stock Market Dip
Imagine you purchased shares in a fintech company at $150 per share. Following a quarterly earnings report that missed expectations, the stock price drops to $120. To understand the severity of this hit to your capital, you apply the formula:
- $150 – $120 = $30 (The absolute loss)
- $30 / $150 = 0.2
- 0.2 * 100 = 20%
In this scenario, your investment has seen a 20% decrease. This percentage is your “drawdown,” a vital metric used by professional traders to assess risk and set stop-loss orders.
Why the “Original Value” is the Anchor
A common mistake in financial calculations is dividing the difference by the new value. In finance, we always measure change relative to where we started. If you divide by the new value, you skew the data, making the loss appear larger than it is. Consistent use of the original value as the denominator ensures that your financial reporting remains accurate and comparable across different time periods.
Analyzing Investment Performance and the “Break-Even” Trap
In wealth management, understanding percentage decrease is only half the battle. The more complex challenge is understanding how a decrease affects your ability to recover. This is where the “Asymmetry of Loss” comes into play—a concept that every serious investor must internalize.
The Mathematics of Recovery
One of the most counterintuitive aspects of money is that a percentage decrease requires a larger percentage increase to return to the original starting point. This is because, after a decrease, you are working with a smaller capital base.
For example, if your portfolio suffers a 50% decrease, you might assume you need a 50% gain to get back to even. However, if $100 drops by 50%, you have $50. To get from $50 back to $100, you need a 100% gain ($50 is 100% of your new $50 base).
Understanding this relationship is crucial for risk management. It explains why preserving capital is often more important than chasing high returns; a 10% decrease only requires an 11.1% gain to recover, but a 25% decrease requires a 33.3% gain.
Evaluating Fund Manager Performance
When reviewing prospectuses for mutual funds or ETFs, you will often see “Maximum Drawdown” listed. This is the largest percentage decrease the fund has experienced from a peak to a trough. By knowing how to work out this percentage, you can compare the volatility of different assets. A fund with a 15% maximum drawdown is significantly more stable—and easier to recover from—than a high-growth fund that has experienced a 40% percentage decrease in a single year.
Cost Optimization: Using Percentage Decrease as a Business KPI
For business owners and corporate financial officers, calculating percentage decrease is a primary tool for measuring efficiency. In this context, a decrease is often a positive outcome, signaling successful cost-cutting measures or improved operational leaness.
Reducing Operating Expenses (OpEx)
In business finance, “trimming the fat” is measured by the percentage decrease in operating expenses. If a company spends $50,000 a month on logistics and implements a new AI-driven routing software that brings that cost down to $42,000, the financial manager must report the effectiveness of that tool.
- ($50,000 – $42,000) / $50,000 = 0.16
- 0.16 * 100 = 16%
A 16% decrease in logistics costs directly improves the net profit margin, making the business more attractive to investors and increasing its valuation.
Debt Reduction and Interest Savings
On a personal finance level, tracking the percentage decrease of your total debt is an excellent psychological and financial motivator. As you pay down a mortgage or high-interest credit card debt, calculating the percentage decrease in the principal balance over six months provides a clear picture of your journey toward financial freedom.
Furthermore, refinancing debt is all about the percentage decrease in interest rates. Moving from an 8% interest rate to a 5% rate isn’t just a “3% drop”—it is a 37.5% decrease in the cost of borrowing (($8 – $5) / $8), which can save thousands of dollars over the life of a loan.
Advanced Financial Metrics: Revenue Contraction and Churn
In the subscription economy and SaaS (Software as a Service) world, certain percentage decreases are viewed as existential threats. Financial analysts focus heavily on “Revenue Churn” and “Customer Churn.”
Measuring Revenue Contraction
If a company’s Monthly Recurring Revenue (MRR) was $200,000 in Q1 and dropped to $180,000 in Q2, the 10% decrease indicates a problem with product-market fit or increased competition. This percentage decrease is a “lagging indicator,” telling the board of directors that the strategies used in the previous quarter were unsuccessful.
The Impact of Customer Churn
Churn is the percentage decrease in your customer base over a specific period. If you start the month with 1,000 subscribers and end with 950 (ignoring new signups), you have a 5% churn rate. In business finance, reducing this percentage decrease is often more profitable than acquiring new customers. A 5% decrease in churn can lead to a 25% to 95% increase in profits, depending on the industry, because the cost of retaining an existing customer is much lower than the cost of acquisition.
Tools and Automation for Financial Calculations
While knowing the manual formula is essential for understanding the logic, modern financial management relies on tools to track percentage decreases across thousands of data points simultaneously.
Excel and Google Sheets Integration
For most financial professionals, Excel is the go-to environment for these calculations. To work out a percentage decrease in a spreadsheet:
- Place the original value in cell A1.
- Place the new value in cell B1.
- In cell C1, enter the formula:
=(A1-B1)/A1. - Click the “Percent” button in the formatting toolbar.
This allows for dynamic tracking. If you are managing a budget, you can see the percentage decrease in your “Dining Out” category update in real-time as you enter your receipts.
Financial Calculators and Dashboards
For investors, platforms like Bloomberg Terminal, Morningstar, or even consumer-grade apps like Mint and Personal Capital, automate these calculations. These tools provide “Time-Weighted Returns” and “Internal Rate of Return” (IRR), which are essentially sophisticated ways of looking at percentage increases and decreases over variable timeframes.
Using these tools, you can set alerts. For instance, you might set a “trailing stop” alert that notifies you if a specific asset experiences a 10% decrease from its 52-week high. This automation ensures that you are making decisions based on mathematical thresholds rather than emotional reactions to market news.
Summary: The Strategic Value of the Percentage Decrease
Mastering how to work out a percentage decrease is more than a simple arithmetic exercise; it is a gateway to deeper financial insight. In the world of money, change is the only constant. By quantifying that change through percentages, you gain the ability to:
- Compare Apples to Apples: Evaluate a $500 loss on a $5,000 investment versus a $5,000 loss on a $50,000 investment (both are 10%).
- Identify Risks: Recognize when a drawdown is reaching a level that makes recovery mathematically difficult.
- Optimize Performance: Measure the exact success of cost-saving initiatives in a business or household.
- Maintain Objectivity: Replace the fear of “the market is going down” with the clarity of “the market has seen a 4% decrease,” allowing for a calm, calculated response.
Whether you are an individual saver, a day trader, or a CFO, the percentage decrease is one of the most powerful lenses through which you can view your financial health. By focusing on the relative change rather than the raw number, you ensure that your financial strategy remains grounded in the reality of mathematical efficiency.
aViewFromTheCave is a participant in the Amazon Services LLC Associates Program, an affiliate advertising program designed to provide a means for sites to earn advertising fees by advertising and linking to Amazon.com. Amazon, the Amazon logo, AmazonSupply, and the AmazonSupply logo are trademarks of Amazon.com, Inc. or its affiliates. As an Amazon Associate we earn affiliate commissions from qualifying purchases.