
In the realm of personal and business finance, numbers are the primary language of progress. Whether you are tracking the growth of a retirement portfolio, analyzing the quarterly revenue of a side hustle, or calculating the impact of inflation on your monthly grocery bill, understanding how to work out percentage increase and decrease is an essential skill.
Percentages provide a standardized way to measure change, allowing investors and entrepreneurs to compare disparate assets and timelines on an equal playing field. While basic arithmetic might seem elementary, the strategic application of these formulas is what separates a passive observer from a savvy financial manager. This guide explores the mathematical foundations of percentage changes and applies them specifically to the contexts of investing, budgeting, and business growth.

The Core Mechanics: Mastering the Formulas for Financial Decision-Making
To make informed financial decisions, one must move beyond “gut feelings” and rely on hard data. The ability to calculate the magnitude of change allows you to quantify your success or identify areas where your capital is underperforming.
The Percentage Increase Formula
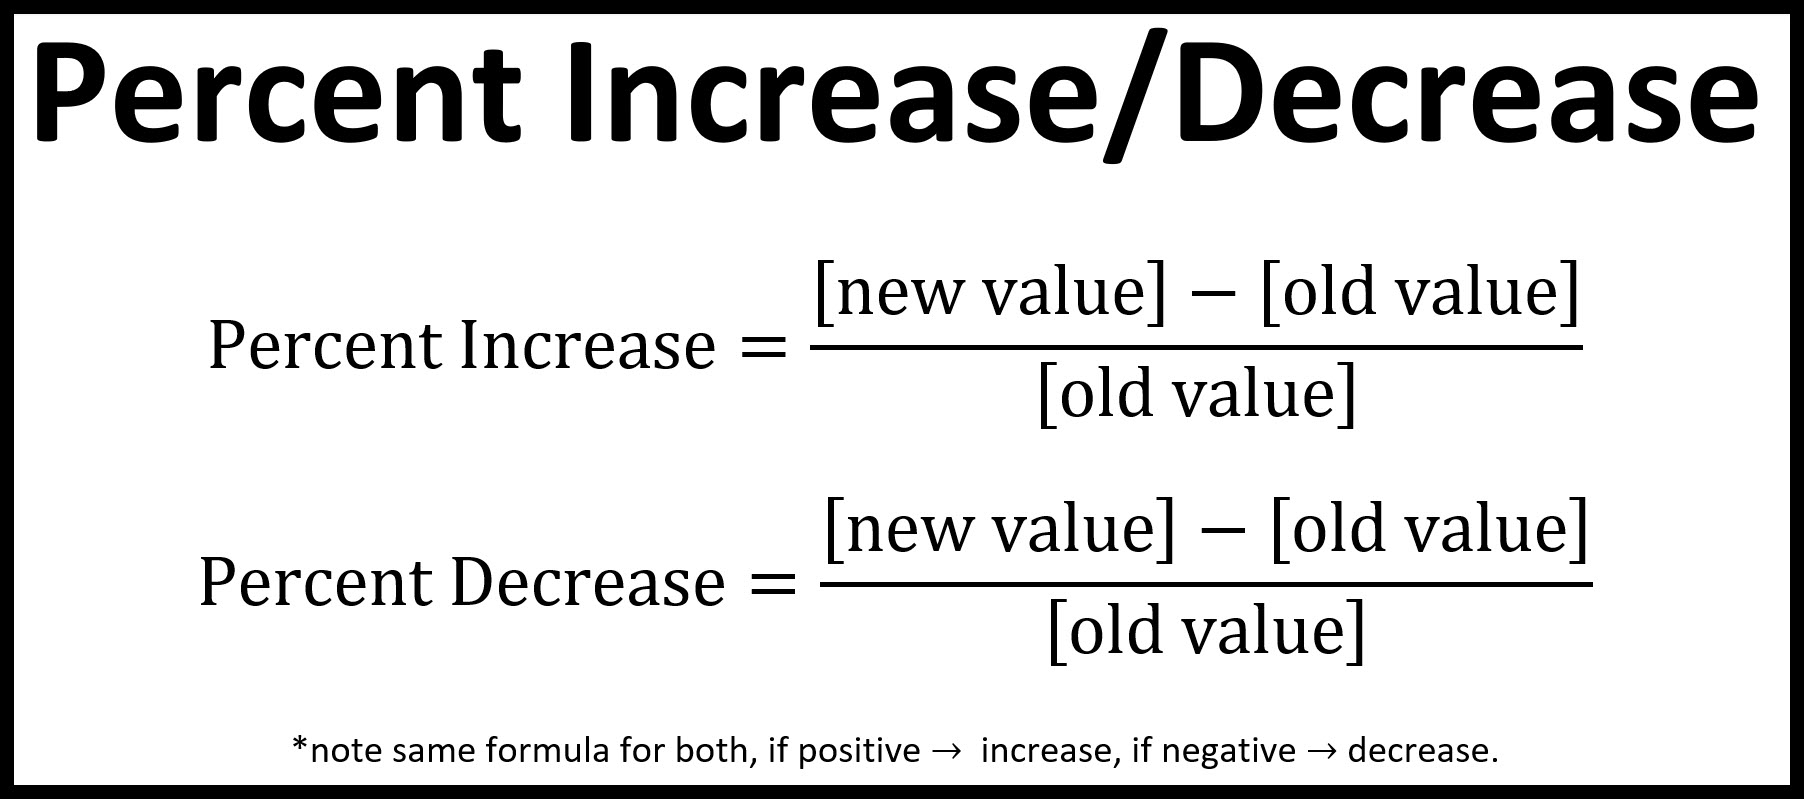
A percentage increase represents how much a value has grown relative to its original starting point. In financial terms, this is often seen in stock price appreciation or salary raises. The formula is:
((New Value – Original Value) / Original Value) × 100
For example, if you invested $5,000 in a mutual fund and its value grew to $5,750 over a year, the calculation would be:
($5,750 – $5,000) / $5,000 = 0.15.
Multiplying by 100 gives you a 15% increase. Understanding this figure allows you to compare that fund’s performance against benchmarks like the S&P 500.
The Percentage Decrease Formula
Conversely, a percentage decrease measures the loss in value relative to the original amount. This is vital for risk management and expense tracking. The formula is identical in structure:
((Original Value – New Value) / Original Value) × 100
If a business expense was $1,200 last month and you optimized operations to bring it down to $900 this month, the calculation would be:
($1,200 – $900) / $1,200 = 0.25.
Multiplying by 100 reveals a 25% decrease in costs. In finance, we often look at percentage decreases to understand “drawdowns” in investment accounts or the effectiveness of cost-cutting measures.
Analyzing Investment Performance: Calculating ROI and Capital Gains
For the modern investor, percentage changes are the ultimate metric of performance. Nominal dollar gains are often misleading; a $1,000 profit is impressive on a $5,000 investment but negligible on a $1,000,000 portfolio. By focusing on percentages, you gain a clearer picture of your Return on Investment (ROI).
Tracking Stock Market Volatility
Volatility is measured by the frequency and magnitude of percentage shifts in asset prices. When a stock “dips” by 10%, it is considered a correction. If it drops by 20% or more, it enters bear market territory.
It is crucial to understand the “asymmetry of loss.” If an investment decreases by 50%, it requires a 100% increase just to return to the original break-even point. For instance, if a $100 stock drops 50%, it is worth $50. To get back to $100, that $50 must grow by $50—which is 100% of its current value. Mastering these calculations helps investors set “stop-loss” orders and manage their risk appetite more effectively.
Real Estate Appreciation and Equity
In real estate, percentage increase is used to track market appreciation. If you purchased a property for $300,000 and five years later it is appraised at $450,000, the percentage increase is 50%. However, a sophisticated investor also calculates the percentage increase in their equity. If you put down $60,000 (20%) and the house value increases by $150,000, your personal equity has grown from $60,000 to $210,000 (excluding mortgage paydown). That is a staggering 250% increase on your initial capital, demonstrating the power of leverage in financial growth.
Personal Budgeting and Inflation: Protecting Your Purchasing Power
Money is not a static resource; its value is constantly shifting due to economic pressures. Using percentage calculations in your personal life helps you maintain your standard of living even when the economy is volatile.

Measuring the Impact of Inflation on Savings
Inflation is essentially a percentage decrease in the purchasing power of your currency. If the annual inflation rate is 4%, a $100 bill today will only buy $96 worth of goods next year. To stay ahead, your income and investment returns must achieve a percentage increase that exceeds the inflation rate.
By calculating the percentage increase in the Consumer Price Index (CPI), individuals can determine if their “cost of living adjustments” (COLA) at work are actually raises or merely keeping pace with rising prices. If you receive a 3% raise but inflation is 5%, you have actually experienced a 2% decrease in real terms.
Optimizing Household Expenses through Percentage Analysis
When looking to save money, it is often more effective to look at the percentage of your total budget that a specific category occupies rather than just the raw dollar amount. If you spend $600 on dining out and your total income is $3,000, that is 20% of your budget. If you can decrease that specific expense by 50% (down to $300), you have effectively increased your total monthly savings rate by 10%.
Applying percentage decrease goals to high-cost categories like insurance premiums, subscription services, or interest rates on debt can lead to significant long-term wealth accumulation.
Business Finance and Profitability: Measuring Growth and Margins
For business owners and side-hustlers, percentage calculations are the pulse of the company. They are used to report to stakeholders, set sales targets, and determine the viability of product lines.
Year-over-Year (YoY) Revenue Growth
Total revenue is a “vanity metric” unless it is compared to previous periods. Working out the percentage increase in revenue Year-over-Year (YoY) or Quarter-over-Quarter (QoQ) allows a business to identify trends.
If a side hustle earned $10,000 in Year 1 and $15,000 in Year 2, it achieved a 50% growth rate. If in Year 3 it earns $20,000, the dollar increase is the same ($5,000), but the percentage increase has slowed to 33.3%. This deceleration is a vital signal to business owners that they may need to find new marketing channels or adjust their pricing strategy to maintain momentum.
Profit Margin Analysis
Profit margin is expressed as a percentage of revenue. If you sell a product for $100 and the cost to produce it is $70, your profit is $30. The “Gross Profit Margin” is the percentage of the selling price that is profit:
($30 / $100) × 100 = 30%.
Business owners must constantly work to increase this percentage. This can be done by achieving a percentage increase in the sales price or a percentage decrease in the cost of goods sold (COGS). A small 2% decrease in manufacturing costs can lead to a disproportionately large increase in net profit, especially when scaled across thousands of units.
Advanced Financial Tools and Automation
While knowing the manual formulas is necessary for quick mental math, the modern financial landscape offers tools that automate these calculations, allowing for deeper analysis of complex datasets.
Utilizing Spreadsheets for Long-Term Tracking
Programs like Microsoft Excel or Google Sheets are the gold standard for financial tracking. By using formulas like =(B2-A2)/A2, you can automatically track the percentage change across hundreds of rows of data.
Investors use spreadsheets to track “Dividend Yield,” which is a percentage calculation of the annual dividend payment divided by the stock price. By automating this, an investor can instantly see which stocks in their portfolio are providing the best cash flow relative to their current market value.
The Role of Financial Calculators in Goal Setting
When planning for retirement or a major purchase, percentage-based tools like CAGR (Compound Annual Growth Rate) calculators are indispensable. Unlike a simple percentage increase, CAGR accounts for the effect of compounding over time.
If you want to grow a $50,000 “seed” investment into $1,000,000 over 20 years, you aren’t just looking for a single percentage increase; you are looking for a consistent annual percentage growth rate (in this case, approximately 16.16%). Understanding how these percentages stack year after year is the key to building sustainable, generational wealth.
Conclusion
Mastering the calculation of percentage increase and decrease is more than a mathematical exercise; it is a fundamental pillar of financial literacy. By applying these formulas, you gain the ability to strip away the noise of raw numbers and see the true trajectory of your financial health. Whether you are mitigating the percentage decrease of a market downturn or maximizing the percentage increase of a high-growth business venture, these tools empower you to make decisions based on logic, strategy, and data. In the world of money, those who understand the percentages are the ones who ultimately control the bottom line.
aViewFromTheCave is a participant in the Amazon Services LLC Associates Program, an affiliate advertising program designed to provide a means for sites to earn advertising fees by advertising and linking to Amazon.com. Amazon, the Amazon logo, AmazonSupply, and the AmazonSupply logo are trademarks of Amazon.com, Inc. or its affiliates. As an Amazon Associate we earn affiliate commissions from qualifying purchases.