
In the contemporary technological landscape, the question “how do you graph a function” has evolved far beyond the traditional confines of graph paper and a straightedge. Today, graphing a function is a sophisticated exercise in data visualization, computational logic, and software engineering. Whether you are a data scientist modeling a neural network’s activation function, an engineer simulating structural stress, or a developer building interactive educational tools, the methodology of visualizing mathematical relationships is rooted in the power of modern technology.
This article explores the professional ecosystem of digital graphing, examining the software, programming libraries, and artificial intelligence tools that have transformed abstract equations into actionable visual insights.
The Evolution of Graphing: From Manual Plots to Digital Precision
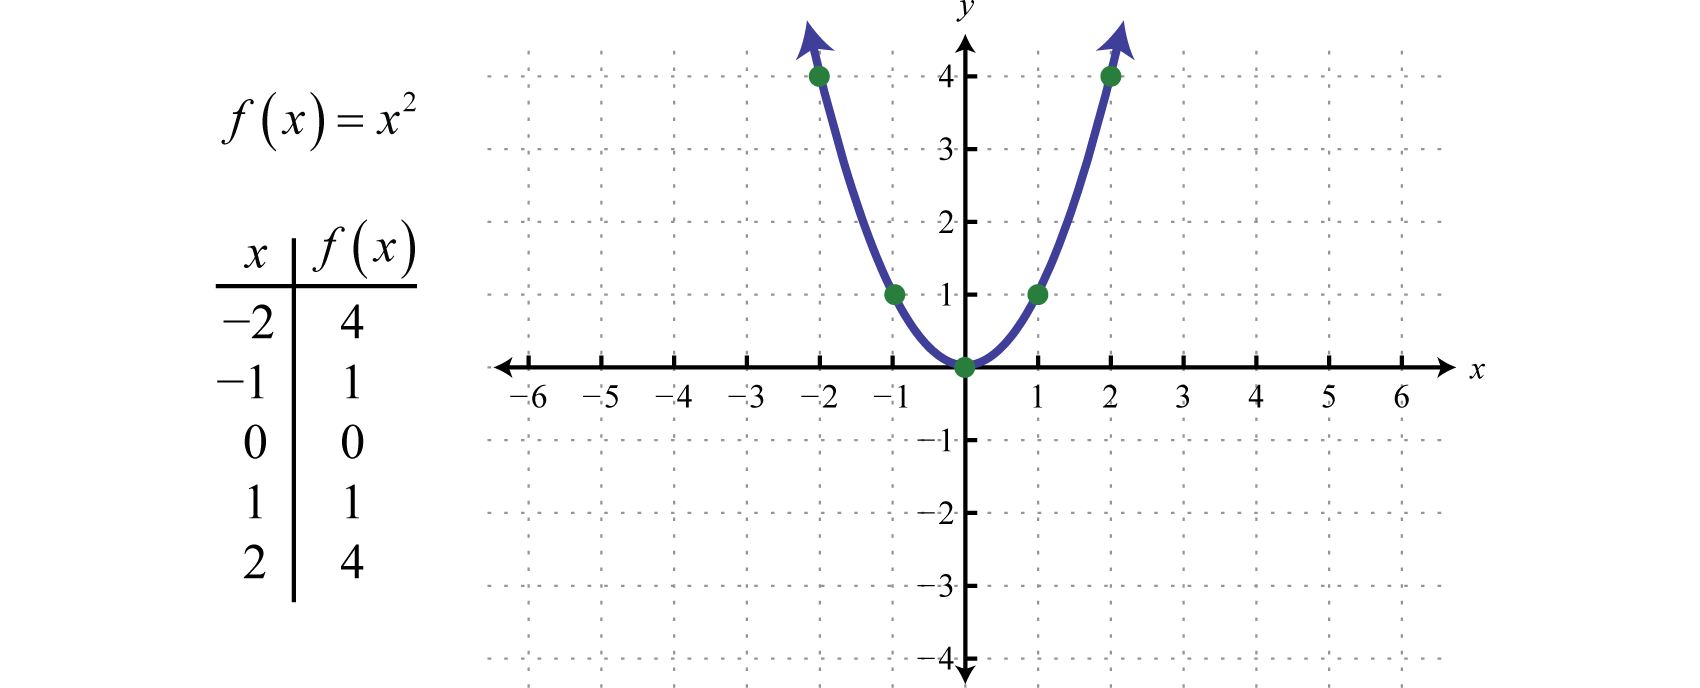
The transition from manual plotting to digital rendering represents one of the most significant leaps in technical efficiency. In the past, graphing a function required a laborious process of calculating coordinates, determining scales, and physically drawing curves—a process prone to human error and limited by two-dimensional constraints.
The Transition to Computational Engines
Modern graphing is powered by computational engines that can process millions of data points in milliseconds. Unlike the static drawings of the past, digital graphs are dynamic entities. When we ask how to graph a function today, we are really asking how to leverage hardware—specifically GPUs (Graphics Processing Units) and high-speed CPUs—to render complex mathematical models. These engines allow for the visualization of functions that were previously impossible to draw by hand, such as high-frequency oscillations or multi-dimensional manifolds.
Why Digital Visualization Matters in the 21st Century
In the tech sector, visualization is more than just an aesthetic choice; it is a diagnostic and analytical necessity. Digital graphing allows for “real-time manipulation.” By adjusting parameters via a slider or a line of code, users can see the immediate impact on the function’s behavior. This interactivity is foundational to modern software development, particularly in fields like fintech for risk modeling or aerospace for trajectory simulation.
Essential Software and Apps for Graphing Functions
To graph a function professionally, one must select the right tool for the specific technical requirement. The market is divided between specialized mathematical software, cloud-based interactive apps, and robust programming environments.
Mathematical Powerhouses: MATLAB and WolframAlpha
For high-level engineering and academic research, MATLAB remains the industry standard. It treats every function as a matrix operation, allowing for incredibly fast computation of complex variables. When graphing a function in MATLAB, the user utilizes a high-level language to define domains and ranges, resulting in publication-quality 2D and 3D plots.
On the more accessible side, WolframAlpha utilizes the “Wolfram Language” to interpret natural language queries. It is a “computational intelligence” engine that doesn’t just draw the line; it provides the derivative, the integral, and the roots of the function simultaneously. This is the pinnacle of “smart” graphing, where the tech understands the intent behind the equation.
Interactive Learning with Desmos and GeoGebra
For those focused on accessibility and UI/UX, Desmos and GeoGebra have revolutionized the web-based graphing experience. These tools use HTML5 and JavaScript to render functions directly in the browser with zero latency. They are prime examples of how “EdTech” (Education Technology) simplifies complex concepts. Through their APIs, developers can embed these graphing engines into other applications, making interactive math a standard feature of modern digital learning platforms.
Open-Source Programming: Python’s Matplotlib and NumPy
For developers and data scientists, the answer to graphing a function almost always lies in Python. The combination of NumPy (for numerical computing) and Matplotlib (for plotting) provides a versatile environment for technical visualization.
- NumPy creates the numerical backbone, generating a “linear space” of values.
- Matplotlib acts as the rendering layer, allowing for the customization of every pixel, from axis labels to color gradients.
This “code-first” approach is essential for automation. If a tech company needs to generate 10,000 different performance graphs based on fluctuating server data, they use Python scripts to graph these functions programmatically rather than manually.
Harnessing AI and Machine Learning for Advanced Function Visualization
The integration of Artificial Intelligence (AI) has added a new layer of sophistication to how we graph functions. We are moving away from purely “reactive” graphing toward “predictive” and “generative” visualization.
Generative AI as a Prompt-Based Graphing Assistant
Large Language Models (LLMs) like GPT-4 and Claude have changed the workflow of graphing. A user can now describe a complex physical phenomenon in plain English—for example, “Graph a decaying sine wave that represents a dampened pendulum”—and the AI will generate the exact Python or LaTeX code required to visualize it. This bridge between natural language and mathematical syntax has lowered the barrier to entry for high-level technical visualization.
Automated Pattern Recognition and Predictive Graphing
In machine learning, graphing functions is used to visualize “loss curves” and “optimization surfaces.” AI tools can now automatically suggest the best way to graph a function to highlight anomalies or trends. For instance, if a function represents a security heartbeat in digital infrastructure, AI-driven graphing tools can automatically zoom into “points of interest” where the function deviates from the norm, effectively acting as an automated monitoring system.
Best Practices for Digital Function Visualization
Simply producing a line on a screen is not enough; professional graphing requires adherence to technical standards that ensure clarity, accuracy, and performance.
Choosing the Right Domain and Scale
One of the most common technical errors in graphing a function is an improperly defined domain. In digital tools, we must define the “sampling rate.” If the sampling rate is too low, a smooth curve will appear jagged (aliasing). If it is too high, it may consume unnecessary computational resources. Tech professionals must balance “visual fidelity” with “computational overhead,” ensuring the graph is accurate without lagging the user interface.
Ensuring Accessibility and Interactivity
Modern web standards (like WCAG) require that digital content be accessible. When graphing functions for a public-facing app, tech teams must consider screen readers and color-blind-friendly palettes. Furthermore, “interactivity” should be purposeful. Features like “hover-to-inspect” (where the coordinates appear as you move the mouse) and “dynamic zooming” are now standard expectations in professional-grade software.
The Future of Graphing: AR, VR, and Real-Time Data Streams
As we look toward the future, the way we graph functions will break free from the two-dimensional screen.
Visualizing Functions in 3D and Spatial Environments
With the rise of Spatial Computing (Apple Vision Pro, Meta Quest), graphing a function is becoming an immersive experience. Engineers can now walk “inside” a 3D function, observing the intersections of complex surfaces in a virtual space. This allows for a more intuitive understanding of multi-variable calculus and topological structures, which are vital in fields like quantum computing and fluid dynamics.
Integration with Real-Time Data Streams
The “Internet of Things” (IoT) is driving the need for functions that graph themselves in real-time. Imagine a function that represents the energy efficiency of a smart city; as sensors collect data, the function updates its coefficients and redraws its curve instantaneously. This fusion of “Live Data” and “Mathematical Modeling” is the current frontier of tech-driven graphing.
Conclusion
In the modern era, graphing a function is a multidisciplinary skill that sits at the intersection of mathematics, software engineering, and design. By leveraging professional tools like MATLAB, mastering libraries like Matplotlib, and utilizing the power of AI, we can transform abstract equations into powerful visual narratives. As technology continues to advance, our ability to visualize the mathematical functions that govern our world will only become more precise, more interactive, and more essential to the global tech ecosystem. Whether through a simple browser-based app or a complex AR environment, the goal remains the same: to turn data into clarity.
aViewFromTheCave is a participant in the Amazon Services LLC Associates Program, an affiliate advertising program designed to provide a means for sites to earn advertising fees by advertising and linking to Amazon.com. Amazon, the Amazon logo, AmazonSupply, and the AmazonSupply logo are trademarks of Amazon.com, Inc. or its affiliates. As an Amazon Associate we earn affiliate commissions from qualifying purchases.