
Understanding percentages is a fundamental skill that transcends academic disciplines, yet its impact is arguably most profound and practical within the realm of finance. From managing your personal budget and evaluating investment returns to dissecting business profitability, percentages serve as the universal language for comparison, change, and proportion. They empower individuals and organizations to make informed decisions by transforming raw numbers into digestible insights. If you’ve ever wondered how much your expenses have grown, what return your portfolio has generated, or the profit margin on a product, you’re asking a question that percentages are designed to answer. This article will demystify the core calculations and illustrate their indispensable applications across personal finance, investing, and business finance, ensuring you’re well-equipped to navigate your financial world with greater clarity and control.

The Fundamental Calculation: Understanding Percentage Basics
Before diving into complex financial scenarios, it’s crucial to grasp the foundational arithmetic of percentages. The beauty of percentages lies in their ability to standardize comparisons, expressing parts of a whole or changes in a simple, universally understood format.
What is a Percentage?
At its simplest, a percentage means “per hundred” or “out of one hundred.” It’s a way of expressing a number as a fraction of 100. For instance, 50% means 50 out of 100, which can also be written as the fraction 50/100 or the decimal 0.50. Percentages allow us to express proportions and changes in a standardized way, making it easier to compare different quantities or rates, regardless of their original scale. They are dimensionless numbers, providing context rather than absolute value.
The Core Formula: Percentage Change and Proportion
The method for calculating a percentage depends on what you’re trying to determine: a part of a whole, a percentage increase/decrease, or finding a number when a percentage is known.
-
Calculating a Part of a Whole: To find what percentage one number (the “part”) is of another number (the “whole”), use this formula:
(Part / Whole) × 100- Example: If you spent $300 on groceries out of your $2,000 monthly income, your grocery spending is ($300 / $2,000) × 100 = 15% of your income.
-
Calculating Percentage Increase or Decrease (Percentage Change): This formula is vital for understanding growth, depreciation, or fluctuations. It requires an “old value” and a “new value.”
((New Value – Old Value) / Old Value) × 100- Example (Increase): If an investment grew from $10,000 to $12,000, the percentage increase is (($12,000 – $10,000) / $10,000) × 100 = ($2,000 / $10,000) × 100 = 20%.
- Example (Decrease): If a stock price fell from $50 to $45, the percentage decrease is (($45 – $50) / $50) × 100 = (-$5 / $50) × 100 = -10% (a 10% decrease).
-
Finding the Number When a Percentage is Known:
- To find the percentage amount of a whole: Convert the percentage to a decimal (divide by 100) and multiply by the whole.
(Percentage / 100) × Whole- Example: To find a 15% discount on a $200 item: (15 / 100) × $200 = 0.15 × $200 = $30.
- To find the original whole when you know the percentage and the part: Divide the part by the percentage (converted to a decimal).
Part / (Percentage / 100)- Example: If a $30 discount represents 15% of the original price, the original price was $30 / (15 / 100) = $30 / 0.15 = $200.
- To find the percentage amount of a whole: Convert the percentage to a decimal (divide by 100) and multiply by the whole.
Practical Examples: Simple Calculations
Let’s illustrate with some everyday financial scenarios:
- Sales Tax: If an item costs $50 and the sales tax is 8%, the tax amount is (8/100) * $50 = $4. The total cost is $50 + $4 = $54.
- Tipping: To calculate a 20% tip on a $75 bill: (20/100) * $75 = $15.
- Small Price Adjustments: A shirt originally priced at $40 is now $32. The percentage decrease is (($32 – $40) / $40) * 100 = (-$8 / $40) * 100 = -20% (a 20% discount).
These fundamental calculations are the building blocks for every financial decision, big or small.
Percentages in Personal Finance: Mastering Your Money
For individuals, percentages are indispensable tools for managing income, expenses, and savings. They provide a clear lens through which to view your financial health and progress.
Budgeting and Expense Tracking
Effective budgeting relies heavily on percentages to allocate income and control spending. Popular budgeting rules, like the 50/30/20 rule, are percentage-based: 50% of your after-tax income for needs, 30% for wants, and 20% for savings and debt repayment.
- To apply this, calculate the percentage of your income each spending category consumes. If your take-home pay is $4,000 and your rent is $1,200, that’s ($1,200 / $4,000) × 100 = 30% of your income dedicated to housing. This percentage helps you immediately see if you’re aligned with your financial goals or if adjustments are needed. Tracking expenses as percentages of income allows you to identify areas where spending might be disproportionately high and make informed cuts or reallocations.
Debt Management and Interest Rates
Understanding interest rates, which are almost universally expressed as percentages, is crucial for managing debt. The Annual Percentage Rate (APR) on loans, mortgages, and credit cards dictates the cost of borrowing.
- If you have a credit card balance of $1,000 with an 18% APR, understanding that 1.5% (18% / 12 months) of that balance could accrue interest monthly helps you prioritize repayment. Calculating the percentage of your payment that goes towards interest versus principal is also enlightening, especially for long-term debts like mortgages. Furthermore, appreciating the power of compound interest—the interest earned on interest—as a positive force for savings but a detrimental one for debt, is key to sound financial planning.
Savings Goals and Financial Growth
Setting and achieving savings goals becomes more tangible with percentages. Your “savings rate” – the percentage of your income you save – is a critical metric for financial independence.
- If you save $500 from a $3,500 monthly income, your savings rate is ($500 / $3,500) × 100 ≈ 14.3%. Tracking this percentage helps you monitor progress towards goals like a down payment on a house or retirement. Moreover, understanding how your savings grow through percentage-based returns (e.g., a 7% annual return on an investment account) illustrates the magic of compounding over time, motivating consistent contributions.
Percentages in Investing: Gauging Returns and Risks
In the investment world, percentages are the primary language used to quantify performance, assess risk, and make strategic asset allocation decisions.
Calculating Investment Returns (ROI)
The most common application is determining your Return on Investment (ROI), a percentage that tells you how much profit or loss you’ve made relative to your initial investment.
- The basic formula for ROI is: ((Current Value – Initial Investment) / Initial Investment) × 100. For example, if you bought a stock for $5,000 and it’s now worth $6,500, your ROI is (($6,500 – $5,000) / $5,000) × 100 = 30%. This simple percentage allows for easy comparison between different investments, even if their initial costs were vastly different. Understanding annualized returns, which adjust for the time frame of an investment, provides an even more accurate picture of performance over different periods.
Understanding Portfolio Allocation
A diversified investment portfolio is built on percentage allocation. Investors decide what percentage of their total assets to allocate to different asset classes—stocks, bonds, real estate, cash—based on their risk tolerance, age, and financial goals.
- A common guideline might suggest a 60% stock / 40% bond allocation for moderate investors. Periodically, you’ll need to “rebalance” your portfolio to bring it back to these target percentages after market fluctuations. For instance, if your stocks perform exceptionally well, their percentage in your portfolio might grow to 70%, requiring you to sell some stocks and buy bonds to return to your original 60/40 target.
Analyzing Market Performance and Volatility
Market news constantly reports percentage changes: “The S&P 500 rose 1.5% today,” or “Company X stock dropped 5% after earnings.” These percentages immediately convey the magnitude of market movements.
- Beyond daily fluctuations, concepts like “percentage drawdown” (the maximum observed loss from a peak to a trough of a portfolio) are critical risk indicators. For more advanced analysis, Beta is a measure of a stock’s volatility relative to the overall market, often expressed as a percentage or a factor (e.g., a Beta of 1.25 means the stock is 25% more volatile than the market). All these metrics use percentages to communicate complex financial information concisely.
Percentages in Business Finance: Driving Profitability and Growth
For entrepreneurs, business owners, and financial professionals, percentages are the bedrock of strategic decision-making, performance evaluation, and investor communication.
Profit Margins and Revenue Analysis
Businesses live and die by their profit margins, all of which are percentage-based. These margins indicate how much profit a company makes for every dollar of revenue.
- Gross Profit Margin: Calculated as ((Revenue – Cost of Goods Sold) / Revenue) × 100. This tells a business how efficiently it produces its goods or services before operating expenses.
- Net Profit Margin: Calculated as ((Net Income / Revenue) × 100. This is the ultimate bottom line, showing the percentage of revenue left after all expenses, including taxes, are accounted for. Analyzing these percentages over time and comparing them to industry benchmarks helps businesses identify operational efficiencies, pricing strategies, and overall financial health. A slight increase in net profit margin, even by 1-2 percentage points, can translate into substantial additional profit for large enterprises.
Discounts, Markups, and Sales Growth
Pricing strategies, promotional activities, and growth targets are frequently expressed using percentages.
- Businesses offer discounts (e.g., “20% off all items”) to attract customers, requiring a clear understanding of the original price and the resulting reduced price. Conversely, markups—the percentage added to a product’s cost to determine its selling price—are crucial for profitability.
- Sales growth, typically measured as the percentage increase in revenue over a previous period (e.g., “Our revenue grew by 15% year-over-year”), is a key indicator of a company’s market success and expansion. Businesses also track percentages like customer acquisition cost relative to customer lifetime value, or the percentage of repeat customers, to gauge marketing effectiveness and loyalty.
Financial Ratios and Performance Metrics
Many critical financial ratios that assess a company’s liquidity, solvency, efficiency, and profitability are expressed as percentages or are derived from calculations that rely on percentages.
- Return on Equity (ROE) and Return on Assets (ROA) are prime examples. ROE measures the percentage of profit a company generates for each dollar of shareholder equity. ROA measures the percentage of profit generated for each dollar of assets. If a company has an ROE of 15%, it means it’s generating 15 cents of profit for every dollar of equity invested by its shareholders. Other crucial percentages include customer churn rate (the percentage of customers a business loses over a period) and conversion rates (the percentage of website visitors who complete a desired action, like making a purchase). These percentages provide actionable insights into operational efficiency and market performance.
Tools and Tips for Accurate Percentage Calculations
While the basic formulas are straightforward, applying them accurately and efficiently, especially with large datasets, requires the right tools and an awareness of common pitfalls.
Leveraging Spreadsheets and Online Calculators
For anything beyond simple, quick calculations, digital tools are invaluable.
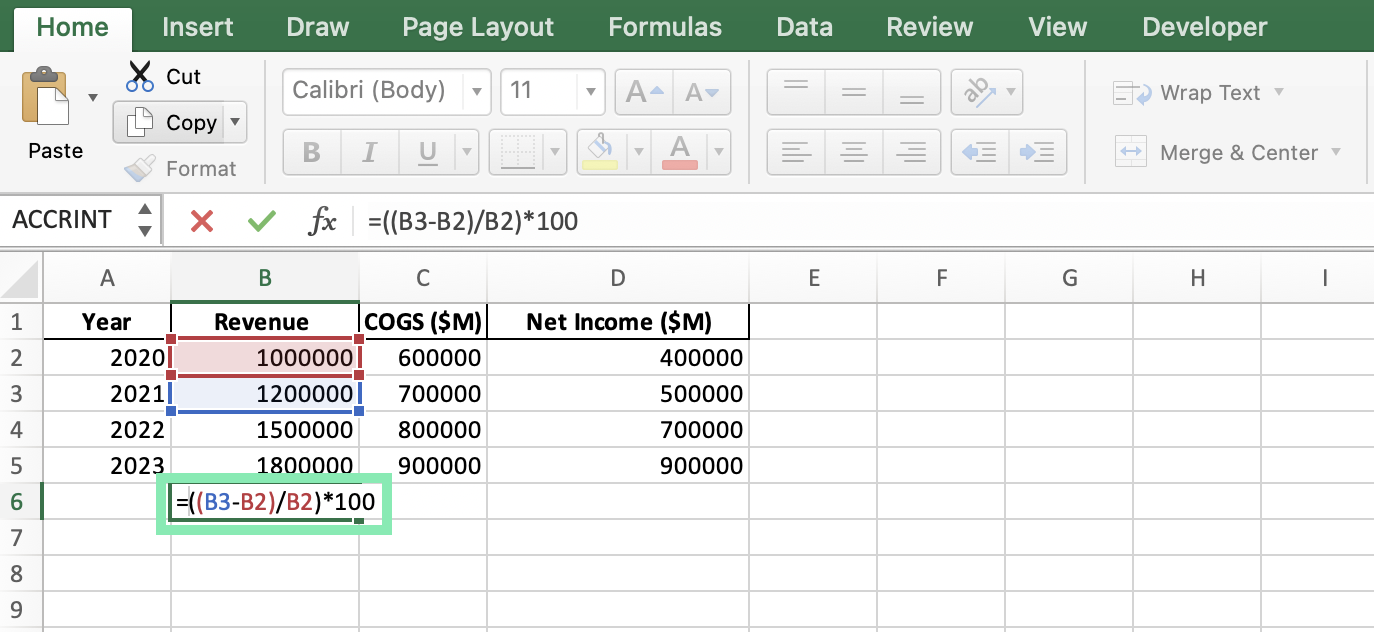
- Spreadsheets (Excel, Google Sheets): These are perhaps the most powerful tools for percentage calculations. You can input values and use formulas like
=(B2-A2)/A2*100for percentage change, or=A1*0.15for 15% of a value. Spreadsheets allow for automation, scenario analysis, and easy tracking of financial metrics over time. - Online Percentage Calculators: Numerous free websites and apps are designed specifically for quick percentage calculations (e.g., “what is X percent of Y,” “X is what percent of Y,” “percentage increase/decrease”).
- Financial Calculators: Dedicated financial calculators can handle more complex percentage-based calculations, especially those involving time value of money (e.g., compound interest, annuities).
Common Pitfalls to Avoid
Even simple calculations can go wrong. Be mindful of these common errors:
- Incorrect Base Value: When calculating percentage change, always ensure you’re dividing by the old or original value. A common mistake is using the new value as the base.
- Rounding Errors: Rounding too early in a multi-step calculation can lead to significant inaccuracies, especially with large numbers or long timeframes (e.g., compound interest).
- “Percentage Points” vs. “Percentage Change”: If an interest rate increases from 5% to 6%, that’s a 1 percentage point increase, but a 20% percentage change (since (6-5)/5 * 100 = 20%). Confusing these can lead to misinterpretations.
- Ignoring Context: Numbers in isolation can be misleading. Always consider the context of the numbers you’re comparing and what the resulting percentage truly signifies.

Developing Financial Literacy Through Percentages
Ultimately, mastering percentage calculations is more than just arithmetic; it’s a foundational pillar of financial literacy. By consistently applying these concepts to your personal budget, investment portfolio, or business operations, you develop a sharper intuition for financial trends, risks, and opportunities. This analytical skill transforms you from a passive observer of numbers into an active, informed participant in your financial journey, empowering you to make smarter decisions and achieve your monetary goals.
In conclusion, the ability to determine the percentage between two numbers is a potent skill that unlocks profound insights across every facet of finance. From the smallest personal budgeting decision to the most complex corporate financial analysis, percentages provide the clarity and comparative power needed to navigate an increasingly data-driven world. By understanding the core formulas, recognizing their widespread applications, and utilizing appropriate tools, you gain a significant advantage in managing your money, making astute investments, and driving business success. Embrace the power of percentages, and take command of your financial future.
aViewFromTheCave is a participant in the Amazon Services LLC Associates Program, an affiliate advertising program designed to provide a means for sites to earn advertising fees by advertising and linking to Amazon.com. Amazon, the Amazon logo, AmazonSupply, and the AmazonSupply logo are trademarks of Amazon.com, Inc. or its affiliates. As an Amazon Associate we earn affiliate commissions from qualifying purchases.