
In the world of high-stakes finance, few phrases carry as much weight as “how did the Dow end today?” For the casual observer, the closing number of the Dow Jones Industrial Average (DJIA) is a simple data point on the evening news. For the serious investor, however, that single figure represents the culmination of millions of global transactions, a reflection of collective economic sentiment, and a benchmark that dictates the health of retirement accounts and institutional portfolios alike.
Understanding the daily performance of the Dow is not just about tracking gains or losses in points; it is about interpreting the narrative of the American economy. As the oldest and most recognized stock market index in the world, the Dow serves as a barometer for the broader financial landscape. To truly grasp why the closing bell matters, one must look beyond the ticker tape and delve into the mechanics, influences, and strategies that define the modern marketplace.
The Anatomy of the Dow Jones Industrial Average
Before dissecting a daily close, it is essential to understand what the Dow Jones Industrial Average actually represents. Established in 1896 by Charles Dow and Edward Jones, the index was originally designed to track the performance of the industrial sector in the United States. Today, it has evolved into a curated list of 30 “blue-chip” companies—industry leaders that are household names, ranging from technology giants to healthcare innovators and retail staples.
A Legacy of Blue-Chip Performance
The 30 companies that comprise the Dow are selected by the S&P Dow Jones Indices committee. Unlike other indices that may include thousands of stocks, the Dow is intentionally narrow. It focuses on large-cap, reputable, and financially sound organizations that have demonstrated consistent growth over time. Because these companies represent such a significant portion of the U.S. GDP, their collective movement—the “ending” price of the day—offers a snapshot of corporate America’s general health. When the Dow ends “up,” it typically suggests a day of optimism and capital inflow into these dominant firms.
The Calculation Methodology: Price-Weighting Explained
A unique characteristic of the Dow is its price-weighting methodology. Most modern indices, such as the S&P 500, are market-cap weighted, meaning larger companies have a bigger impact based on their total value. The Dow, however, is calculated based on the share price of its components. A stock trading at $200 will have a greater influence on the Dow’s daily movement than a stock trading at $50, regardless of the company’s total size. This nuance is critical when answering “how did the Dow end today,” as a massive swing in just one high-priced component can disproportionately skew the entire index’s performance.
Why the Closing Bell Matters to Your Portfolio
The “close” of the market at 4:00 PM EST is more than just the end of a workday; it is the official record-keeping moment for the financial world. The closing price is the final price at which a stock is traded during regular market hours, and it is used as the standard reference for nearly all financial reporting and valuation.
Institutional Benchmarking and Mutual Fund Pricing
For the individual investor, the daily close of the Dow is intrinsically linked to the valuation of mutual funds and exchange-traded funds (ETFs). Mutual funds calculate their Net Asset Value (NAV) based on the closing prices of the securities they hold. If you are checking your 401(k) or brokerage account, the “daily change” you see is almost always calculated from the previous day’s Dow close to the current day’s close. Institutional investors also use the daily close to rebalance portfolios and ensure their holdings align with their strategic benchmarks.
Sentiment and the “Overnight” Risk Factor
The way the Dow ends the day often sets the tone for global markets. Because of time zone differences, the U.S. market close influences the opening of Asian and European markets. A “strong finish” in the Dow can lead to a “risk-on” sentiment globally, while a sharp decline at the closing bell may trigger panic selling in overseas markets. Furthermore, the closing price serves as the baseline for “after-hours” trading, where news released after 4:00 PM—such as earnings reports or geopolitical shifts—can cause the price to deviate significantly before the next day’s opening bell.
Macroeconomic Influences on Daily Performance
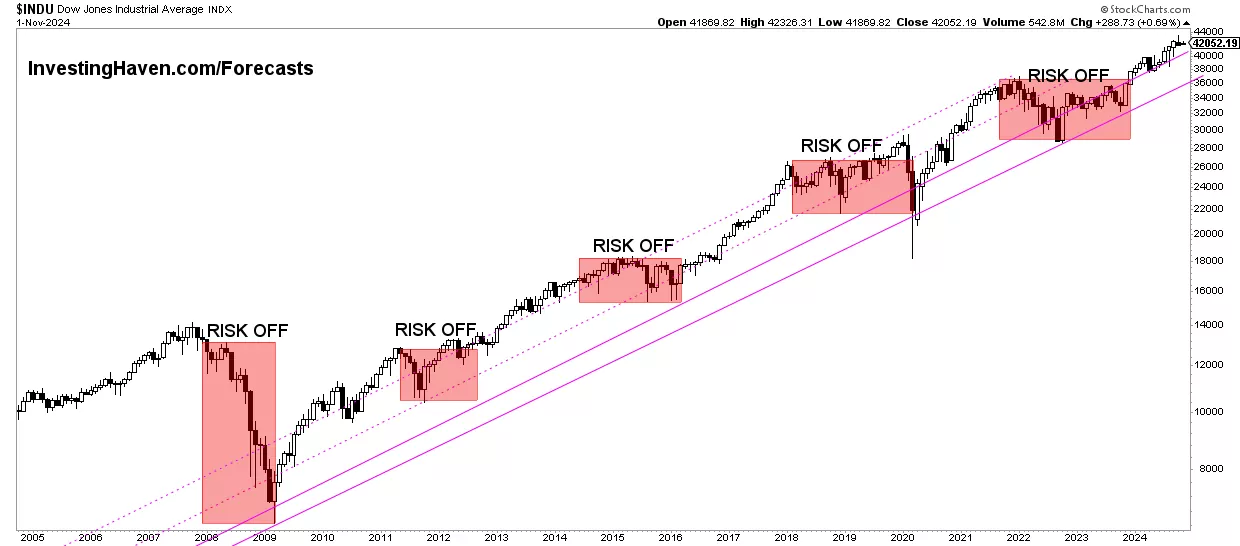
When the Dow ends higher or lower, it is rarely a random occurrence. The index is a sensitive instrument that reacts to a variety of macroeconomic signals. Investors who want to understand the “why” behind the daily numbers must monitor several key drivers.
The Role of the Federal Reserve and Interest Rates
Perhaps no single entity influences the Dow’s daily finish more than the Federal Reserve. Decisions regarding interest rates are the lifeblood of the financial markets. When the Fed signals a “hawkish” stance (rising interest rates to combat inflation), the Dow often ends the day in the red. Higher rates increase borrowing costs for companies and can slow consumer spending. Conversely, a “dovish” stance (lowering or maintaining rates) typically fuels a market rally, as cheap capital encourages corporate expansion and investment.
Earnings Season and Corporate Guidance
Four times a year, the companies within the Dow release their quarterly earnings reports. These periods, known as “earnings season,” see the highest levels of volatility. If a Dow component like Apple or Goldman Sachs reports record profits and, more importantly, provides “positive guidance” (an optimistic outlook for the future), it can single-handedly lift the index. If several blue-chip companies miss their targets on the same day, the Dow is likely to end with significant losses, reflecting a lack of confidence in the near-term profitability of the private sector.
Decoding Market Volatility: Points vs. Percentages
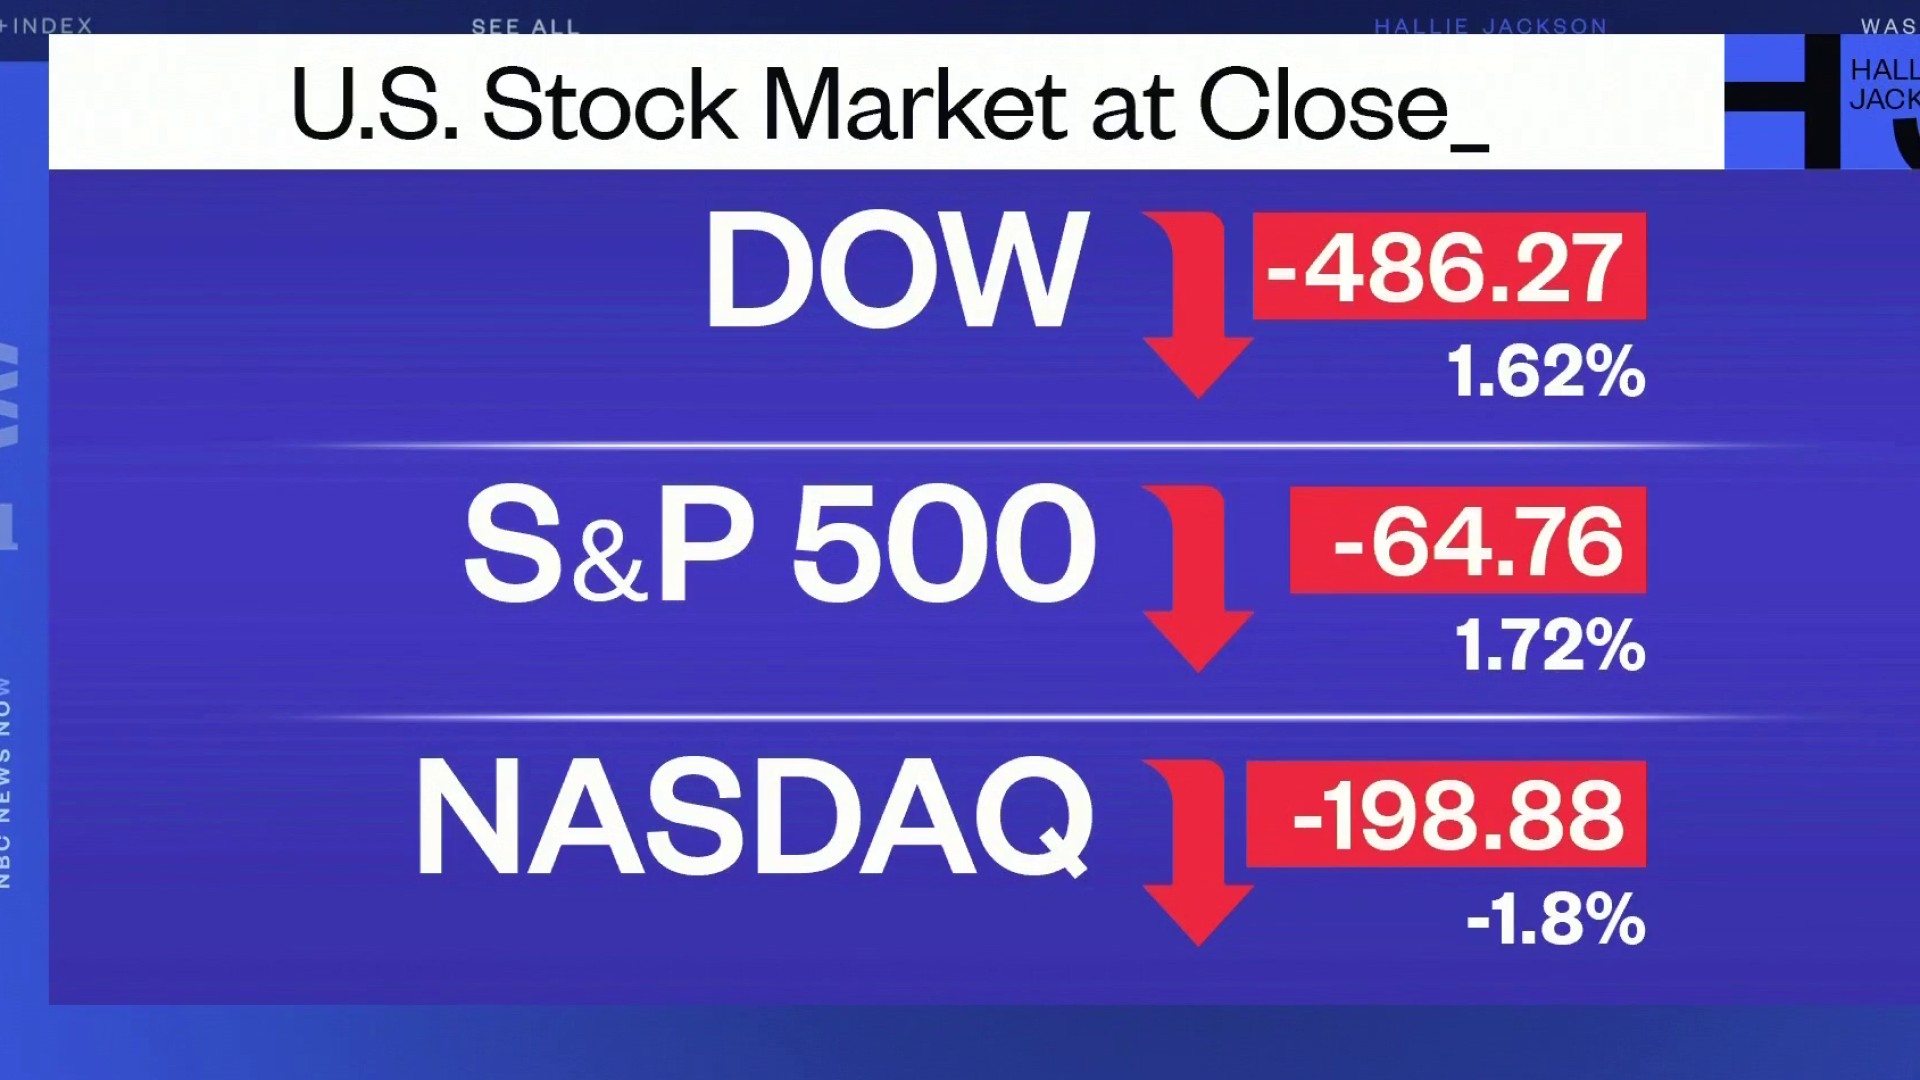
One of the most common mistakes investors make when asking “how did the Dow end today” is focusing solely on the “points.” In the modern era, the Dow is often quoted in five-digit figures (e.g., 38,000 or 40,000). A “500-point drop” sounds catastrophic, but in the context of a 40,000-point index, it represents a movement of only 1.25%.
The Importance of Contextualizing Moves
Historical context is vital for financial literacy. In 1987, a 500-point drop would have meant the collapse of the entire market. Today, it is a standard Tuesday. To truly understand market performance, savvy investors look at the percentage change rather than the raw point total. This perspective prevents emotional decision-making and helps maintain a realistic view of market volatility.
The VIX and Market Breadth
The Dow’s ending price is often analyzed alongside the CBOE Volatility Index (VIX), commonly known as the “fear gauge.” If the Dow ends down and the VIX is spiking, it indicates high levels of investor anxiety. Additionally, analysts look at “market breadth”—how many individual stocks within the index actually moved in the same direction. If the Dow ends “up” but only five of the thirty stocks gained value, the rally is considered “thin” and potentially unsustainable.
Navigating Volatility: Strategic Responses to Market Fluctuations
For the personal investor, the goal is not just to know how the Dow ended, but to know what to do with that information. Daily fluctuations are “noise,” while long-term trends are “signals.”
The Danger of Emotional Reaction
The greatest threat to a long-term investment strategy is the “recency bias”—the tendency to believe that what happened today will continue to happen indefinitely. If the Dow ends in a steep decline for three consecutive days, the impulse is often to sell and “protect” what remains. However, market history shows that some of the Dow’s best days occur immediately following its worst. Successful investing requires the emotional discipline to ignore the daily closing “drama” in favor of a disciplined, long-term plan.

Long-Term Wealth Building Through Indexing
Rather than trying to time the market based on daily closes, many successful investors utilize a “buy and hold” strategy through index funds or ETFs that track the Dow. By staying invested through the highs and lows, they benefit from the compounding growth of the 30 most powerful companies in the world. Tracking the Dow becomes less about daily stress and more about monitoring the long-term trajectory of one’s wealth-building journey.
In conclusion, “how did the Dow end today” is a question that opens the door to a deeper understanding of the financial world. Whether the market ends in the green or the red, the closing price is a reflection of the complex interplay between corporate performance, government policy, and human psychology. By analyzing these factors through a professional and disciplined lens, investors can move beyond the headlines and build a more secure financial future.
aViewFromTheCave is a participant in the Amazon Services LLC Associates Program, an affiliate advertising program designed to provide a means for sites to earn advertising fees by advertising and linking to Amazon.com. Amazon, the Amazon logo, AmazonSupply, and the AmazonSupply logo are trademarks of Amazon.com, Inc. or its affiliates. As an Amazon Associate we earn affiliate commissions from qualifying purchases.