In the vast and often volatile world of finance, understanding risk and variability is paramount. Investors, financial analysts, and business leaders constantly seek metrics that can provide clarity on the stability and predictability of assets, portfolios, or operational performance. While averages provide a central tendency, they often mask the underlying fluctuations that dictate true risk. This is where measures of dispersion become indispensable. Among these, the mean deviation stands out as a fundamental, intuitive, yet often underestimated tool for dissecting the spread of data points around their average, offering crucial insights into financial stability and potential volatility.
The mean deviation, also known as the average absolute deviation, serves as a straightforward measure of statistical dispersion. Unlike more complex statistical siblings like standard deviation, the mean deviation provides a direct and easily interpretable average of the absolute differences between each data point and the mean of the dataset. For financial practitioners, this means gaining a clearer picture of how much individual returns or performance metrics typically deviate from their average, without the mathematical complexities that can sometimes obscure intuition. In an environment where every percentage point of volatility can translate into significant gains or losses, grasping the essence of mean deviation is not just academic; it’s a strategic imperative.
This article will delve into the core concept of mean deviation, elucidate its calculation, and critically assess its relevance and application within various facets of finance, from personal investing to corporate financial management. We will explore how this measure helps in quantifying risk, evaluating performance, and informing strategic financial decisions, while also acknowledging its limitations and the importance of integrating it with a broader suite of analytical tools for a comprehensive financial perspective.
Unpacking the Concept: Definition and Core Principles
To truly appreciate the utility of mean deviation in finance, it’s essential to first grasp its fundamental definition and the principles that govern its calculation. It’s a measure designed to give a sense of how “spread out” a set of numbers is.
The Essence of Dispersion: Beyond Averages
At its heart, the mean deviation addresses a critical blind spot of averages. An average (mean) can tell us what the typical value is, but it tells us nothing about the distribution of individual values around that typical point. Consider two investment portfolios, both yielding an average annual return of 10% over five years. One portfolio consistently delivered returns between 9% and 11%, while the other swung wildly from -10% to +30%. While their averages are identical, their risk profiles are vastly different. The mean deviation provides a quantitative measure of this spread, indicating the average magnitude of these individual deviations from the mean. It quantifies the typical distance of data points from their central value, offering a more complete picture than the mean alone. This is particularly vital in finance, where an average return doesn’t necessarily reflect the journey taken to achieve it, and that journey often dictates the risk an investor is exposed to.
How Mean Deviation is Calculated: A Step-by-Step Guide
The calculation of the mean deviation is remarkably straightforward, making it accessible even for those with limited statistical backgrounds. It involves three primary steps:
- Calculate the Mean (Average) of the Data Set: Sum all the data points and divide by the number of data points. For example, if you have daily stock returns, calculate the average daily return over a specific period.
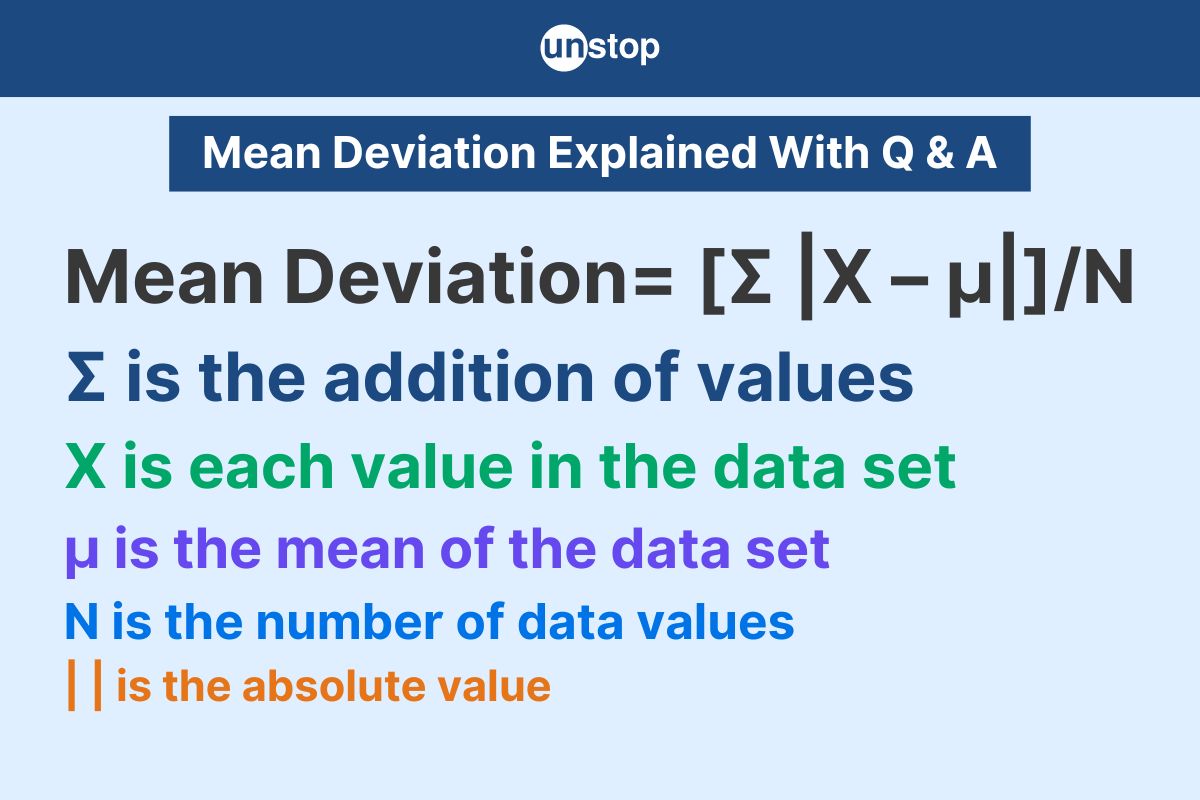
- Calculate the Absolute Deviations from the Mean: For each data point, subtract the mean, and then take the absolute value of that difference. The absolute value is crucial because it ensures that negative deviations (values below the mean) do not cancel out positive deviations (values above the mean), which would misleadingly suggest less dispersion.
- Calculate the Mean of the Absolute Deviations: Sum all the absolute deviations calculated in step 2, and then divide by the total number of data points. This final result is the mean deviation.
Formulaically:
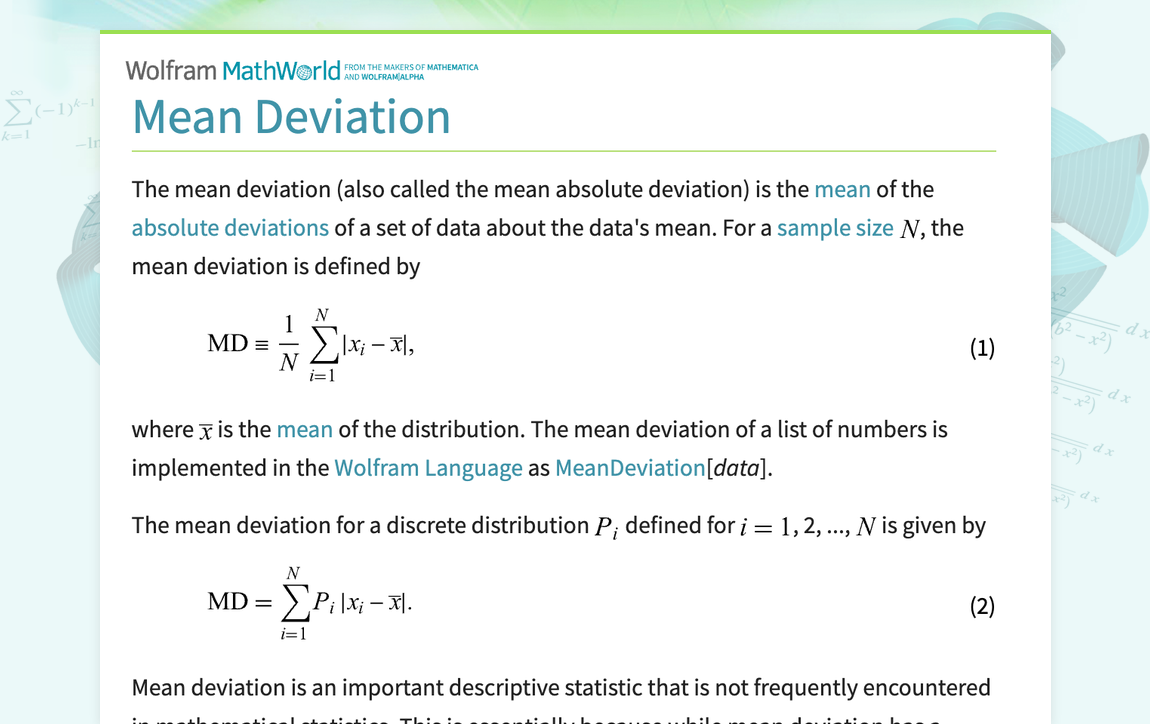
For a dataset $X = {x1, x2, …, xn}$, and its mean $bar{x}$:
Mean Deviation (MD) $= frac{1}{n} sum{i=1}^{n} |x_i – bar{x}|$
This calculation yields a single number that represents the average absolute distance of each data point from the mean, providing a clear and intuitive measure of data dispersion.
Differentiating from Standard Deviation: Key Nuances
While often overshadowed by its more sophisticated counterpart, standard deviation, the mean deviation holds distinct characteristics. Both are measures of dispersion, but they differ in their mathematical approach and implications:
- Treatment of Deviations: Mean deviation uses the absolute values of deviations. Standard deviation, on the other hand, squares the deviations, sums them, divides by the number of observations (or $n-1$ for a sample), and then takes the square root. Squaring deviations gives greater weight to larger deviations, making standard deviation more sensitive to outliers.
- Interpretability: Mean deviation is often considered more intuitive because it literally represents the “average” deviation. If the mean deviation of a stock’s returns is 2%, it means, on average, its daily return deviates by 2% from its mean return. Standard deviation, due to the squaring and square-rooting process, is less directly interpretable in this “average deviation” sense but aligns with certain theoretical properties of normal distributions.
- Mathematical Properties: Standard deviation is mathematically more robust and preferred in many advanced statistical analyses, especially those involving inferential statistics, hypothesis testing, and portfolio theory (e.g., modern portfolio theory relies heavily on variance and standard deviation for optimization). It’s a key component in calculating variance, beta, and other critical financial metrics.
- Applications: While standard deviation is the cornerstone of advanced risk modeling, mean deviation can be valuable in situations where a simple, easily communicable measure of variability is needed, or when outliers are not meant to disproportionately influence the measure of spread.
Understanding these differences helps in selecting the appropriate measure depending on the specific analytical context and the desired level of detail or mathematical rigor.
Why Mean Deviation Matters in Finance
The intuitive nature and straightforward calculation of mean deviation make it a valuable, albeit sometimes underutilized, tool in the financial analyst’s toolkit. Its relevance spans several critical areas, offering insights into risk, performance, and operational stability.
Assessing Investment Risk and Volatility
In the realm of investments, risk is often synonymous with volatility – the degree to which an asset’s price or return fluctuates over time. A higher mean deviation in an asset’s historical returns suggests greater volatility and, consequently, higher risk. For instance, comparing two stocks with similar average returns, the one with a higher mean deviation implies a more erratic performance history, signaling a greater chance of significant upward or downward price swings. This metric can help investors gauge the stability of an investment, aiding in decisions related to risk tolerance and asset allocation. It provides a direct numerical representation of how “bumpy” an investment ride has been or might be.
Portfolio Performance Evaluation
Beyond individual assets, mean deviation can be instrumental in evaluating the performance consistency of an entire investment portfolio. A portfolio with a lower mean deviation of its aggregate returns indicates more stable performance, which is often desirable for risk-averse investors. By calculating the mean deviation of a portfolio’s monthly or quarterly returns, investors can assess the consistency of their returns against the portfolio’s average. This helps in understanding whether the portfolio reliably generates returns close to its average or if it experiences wide fluctuations, which could impact liquidity or rebalancing strategies. It serves as a complementary metric to total return, offering a qualitative perspective on the journey to that return figure.
Business Finance: Operational Stability and Risk Management
The utility of mean deviation extends beyond capital markets into the core operations of businesses. In business finance, understanding the variability of key financial metrics is crucial for effective planning, budgeting, and risk management.
- Cash Flow Management: Businesses can use mean deviation to analyze the variability of their monthly cash inflows and outflows. A high mean deviation in cash flows could indicate an unpredictable financial environment, necessitating larger cash reserves or more robust liquidity management strategies.
- Sales Forecasting: Analyzing the mean deviation of past sales data can provide insights into the consistency of sales performance. This helps in setting more realistic sales targets and production schedules, and identifying periods of greater or lesser sales predictability.
- Cost Control: Similarly, tracking the mean deviation of operational costs can highlight areas where expenses are highly variable, allowing management to investigate underlying causes and implement cost stabilization measures.
By quantifying operational variability, mean deviation empowers businesses to make more informed decisions about resource allocation, risk mitigation, and strategic planning, ultimately contributing to greater financial resilience.
Practical Applications Across Financial Domains
The versatility of mean deviation allows for its practical application across a spectrum of financial activities, from guiding individual investment choices to informing high-level corporate financial strategy.

Personal Investing: Understanding Your Portfolio’s Swings
For the individual investor, particularly those managing their own portfolios, mean deviation offers an accessible way to personalize risk assessment. By calculating the mean deviation of their portfolio’s historical returns, investors can gain a concrete understanding of their portfolio’s typical volatility. This insight is invaluable for:
- Aligning with Risk Tolerance: An investor with a low risk tolerance might prefer a portfolio with a lower mean deviation, even if it means potentially lower average returns. Conversely, an investor comfortable with higher risk might accept a higher mean deviation in pursuit of greater potential returns.
- Portfolio Rebalancing Decisions: Understanding how much their portfolio typically deviates from its target asset allocation can inform rebalancing strategies. If a certain asset class consistently shows high mean deviation and pushes the portfolio beyond its desired risk profile, it might signal a need for adjustment.
- Realistic Expectation Setting: Mean deviation helps in tempering expectations. An average return of 10% with a mean deviation of 1% is vastly different from an average return of 10% with a mean deviation of 5%. The latter implies a much wider range of possible outcomes around that 10% average.
Corporate Finance: Predicting and Managing Cash Flow Fluctuations
In corporate finance, the stability of cash flow is a lifeblood. Businesses thrive on predictability, and fluctuations can lead to liquidity crises or missed opportunities. Mean deviation becomes a crucial tool for:
- Working Capital Management: Companies can analyze the mean deviation of their accounts receivable and payable cycles to predict potential shortfalls or surpluses in working capital. High variability in collections or payments might necessitate larger lines of credit or more aggressive cash management policies.
- Budgeting and Forecasting Accuracy: By understanding the mean deviation of various revenue streams and expense categories, financial planners can build more robust budgets that account for potential variability, rather than relying solely on point estimates.
- Investment Project Appraisal: When evaluating potential investment projects, analyzing the mean deviation of expected cash flows can help assess the project’s inherent risk. Projects with highly volatile cash flow projections might require a higher discount rate or more stringent risk mitigation strategies.
Market Analysis: Gauging Sector Stability
Beyond individual entities, mean deviation can provide macroeconomic insights. Analysts can apply it to broader market indices, sectors, or even economic indicators to gauge overall stability or volatility. For instance:
- Sector Volatility Comparison: Comparing the mean deviation of daily returns across different industry sectors can reveal which sectors are historically more stable or more prone to dramatic swings. This insight is vital for sector rotation strategies or for understanding systemic risks.
- Economic Indicator Stability: Analyzing the mean deviation of economic indicators like GDP growth, inflation rates, or unemployment figures can help economists and policymakers understand the consistency of economic performance and identify periods of heightened economic instability.
These applications underscore how mean deviation, despite its simplicity, can provide powerful, actionable insights across the financial landscape.
Limitations and Complementary Metrics
While mean deviation offers valuable insights, it is not without its limitations. Like any single statistical measure, it provides a partial view of reality. Recognizing these shortcomings is crucial for its effective application and for understanding when to leverage more advanced tools.
When Mean Deviation Might Fall Short
The primary limitation of mean deviation stems from its use of absolute values. While this makes it intuitive, it presents challenges for further mathematical analysis. Unlike variance and standard deviation, mean deviation does not fit as neatly into the framework of inferential statistics, which relies heavily on properties derived from squared deviations (e.g., the additive property of variances for independent variables).
- Sensitivity to Outliers: While less sensitive than standard deviation, mean deviation can still be influenced by extreme values. A single very large deviation can significantly inflate the mean deviation, potentially misrepresenting the typical dispersion if that outlier is not representative.
- Lack of Mathematical Tractability: The absolute value function is not differentiable everywhere, which complicates its use in optimization problems and advanced statistical modeling techniques that rely on calculus. This is a major reason why standard deviation is preferred in areas like Modern Portfolio Theory.
- Ignores the Direction of Deviation: By taking absolute values, mean deviation treats positive and negative deviations equally. In some financial contexts, the direction of deviation might be significant (e.g., downside risk versus upside potential).
For these reasons, while excellent for quick, intuitive understanding, mean deviation is rarely the sole measure of dispersion used in sophisticated financial analysis.
Integrating with Other Statistical Measures for a Holistic View
Given its limitations, mean deviation is best utilized as part of a broader analytical framework, complemented by other statistical measures that offer different perspectives on financial data:
- Standard Deviation/Variance: These are essential for more rigorous risk assessment, especially in portfolio optimization, options pricing, and understanding the spread of data in contexts where a normal distribution can be assumed. They give more weight to extreme events.
- Skewness: While mean deviation tells us about the spread, skewness tells us about the symmetry of the distribution. In finance, a negatively skewed distribution (fat tail on the left) indicates a higher probability of extreme negative returns, which is critical for risk management.
- Kurtosis: This measure describes the “tailedness” of a distribution. High kurtosis (leptokurtic distribution) suggests more frequent extreme positive or negative outcomes than a normal distribution, implying fatter tails and higher tail risk – a crucial insight for financial markets.
- Maximum Drawdown: This metric quantifies the largest peak-to-trough decline in an investment’s value over a specific period, providing a measure of downside risk that mean deviation doesn’t capture directly.
- Value at Risk (VaR): VaR estimates the maximum expected loss over a given period at a certain confidence level, offering a probabilistic view of downside risk.
By combining mean deviation with these complementary metrics, financial professionals can build a much richer and more nuanced understanding of risk, return, and performance consistency, leading to more robust decision-making.
Leveraging Mean Deviation for Informed Financial Decisions
Despite its simplicity and certain limitations, mean deviation offers a direct and intuitive window into data dispersion that, when properly contextualized, can significantly enhance financial decision-making. Its strength lies in its clarity and ease of interpretation, making complex concepts of variability accessible.
Enhancing Risk-Adjusted Returns
For investors, the ultimate goal is not just high returns, but high returns relative to the risk taken – a concept known as risk-adjusted returns. Mean deviation can play a supporting role in this assessment:
- Identifying Stable Performers: By comparing investments with similar average returns, the one with a lower mean deviation often represents a more stable and potentially less stressful path to those returns. While standard deviation is often used in ratios like the Sharpe Ratio, a simple inspection of mean deviation can quickly highlight options where returns are more consistent.
- Behavioral Finance Insights: Investors often struggle with volatility. A portfolio with a lower mean deviation, implying less fluctuation, might lead to better investor behavior (less panic selling during downturns) and thus better long-term results, even if its standard deviation is not the absolute lowest. Understanding this inherent “bumpiness” can help investors choose strategies that align with their psychological tolerance for market swings.
- Pre-screening for Consistency: In a large universe of potential investments, mean deviation can serve as a quick pre-screening tool to filter out highly erratic options before delving into more complex risk analyses.
By consciously considering the mean deviation, investors can make choices that not only aim for growth but also prioritize a smoother, more predictable financial journey, enhancing their overall experience and potentially their actual risk-adjusted outcomes.
Strategic Allocation and Diversification
Diversification is the cornerstone of prudent investing, aiming to reduce overall portfolio risk by combining assets that don’t move in perfect lockstep. Mean deviation can indirectly support diversification strategies:
- Understanding Component Volatility: Before combining assets, understanding the mean deviation of each individual asset’s returns gives a clear picture of its inherent volatility. This knowledge helps in constructing a portfolio where individual volatilities are balanced or offset.
- Assessing Portfolio Stability: While correlations are key to diversification, mean deviation provides an overall measure of how stable the resulting diversified portfolio is. A well-diversified portfolio should ideally exhibit a lower mean deviation of its aggregate returns than the average of its individual components’ mean deviations, reflecting the risk-reducing benefits of diversification.
- Risk Budgeting: In a risk budgeting framework, where a certain amount of risk is allocated across different asset classes, mean deviation can provide an initial estimate of the “risk contribution” of each asset in terms of its standalone variability, guiding decisions on how much exposure to take in inherently more volatile assets.
Ultimately, the mean deviation, while a fundamental statistical concept, offers practical and actionable insights for anyone navigating the complexities of finance. It serves as an intuitive compass for understanding variability, guiding decisions in personal investing, corporate finance, and market analysis, and reinforcing the principle that in finance, understanding the ‘how’ behind the numbers is just as crucial as the numbers themselves. By integrating this simple yet powerful measure into their analytical toolkit, financial decision-makers can foster greater clarity, manage risk more effectively, and work towards more stable and predictable financial outcomes.
aViewFromTheCave is a participant in the Amazon Services LLC Associates Program, an affiliate advertising program designed to provide a means for sites to earn advertising fees by advertising and linking to Amazon.com. Amazon, the Amazon logo, AmazonSupply, and the AmazonSupply logo are trademarks of Amazon.com, Inc. or its affiliates. As an Amazon Associate we earn affiliate commissions from qualifying purchases.