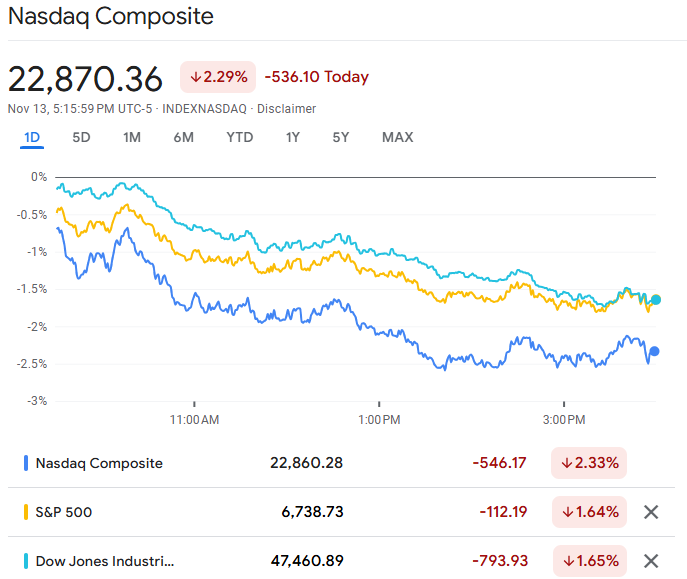
The stock market is often described as a “manic-depressive” entity, swinging between irrational exuberance and unbridled fear. For the modern investor, seeing a sea of red across a brokerage dashboard can be a jarring experience. When the major indices—the S&P 500, the Dow Jones Industrial Average, and the Nasdaq—stumble simultaneously, the immediate question on everyone’s mind is: Why did stocks drop today?
Market fluctuations are rarely the result of a single isolated event. Instead, they are usually the culmination of macroeconomic data, corporate performance, and the collective psychology of millions of participants. Understanding the “why” behind a market downturn is essential for moving past the initial emotional reaction and making informed, strategic financial decisions. This guide explores the primary catalysts behind market drops, the technical mechanisms that accelerate sell-offs, and how investors can navigate these turbulent waters.
Macroeconomic Catalysts: The Big Picture Influencing Your Portfolio
The most common drivers of a broad market decline are “macro” factors—large-scale economic forces that affect all companies, regardless of their individual health. When the fundamental landscape of the economy shifts, investors quickly reprice assets to reflect new risks.
Interest Rates and the Federal Reserve’s Stance
Perhaps no single entity has more influence over the stock market than the Federal Reserve. Interest rates are essentially the “gravity” of the financial world. When interest rates are low, borrowing is cheap, which encourages corporate expansion and consumer spending. However, when the Fed signals that it will raise or maintain high interest rates to combat inflation, stocks often drop. Higher rates increase the cost of capital, making it more expensive for companies to fund growth. Furthermore, higher rates make fixed-income assets, like bonds, more attractive relative to stocks, causing a capital flight from the equity markets.
Inflation Data and Consumer Price Index (CPI) Reports
Inflation is the silent killer of purchasing power, and the stock market loathes uncertainty regarding price stability. When CPI or PPI (Producer Price Index) reports come in “hotter” than expected, it suggests that the economy is overheating. Investors react to this by anticipating that the Federal Reserve will have to keep rates high for longer. High inflation also squeezes corporate margins; if the cost of raw materials and labor rises faster than a company can raise prices for its customers, profits shrink, leading to a decline in stock prices.
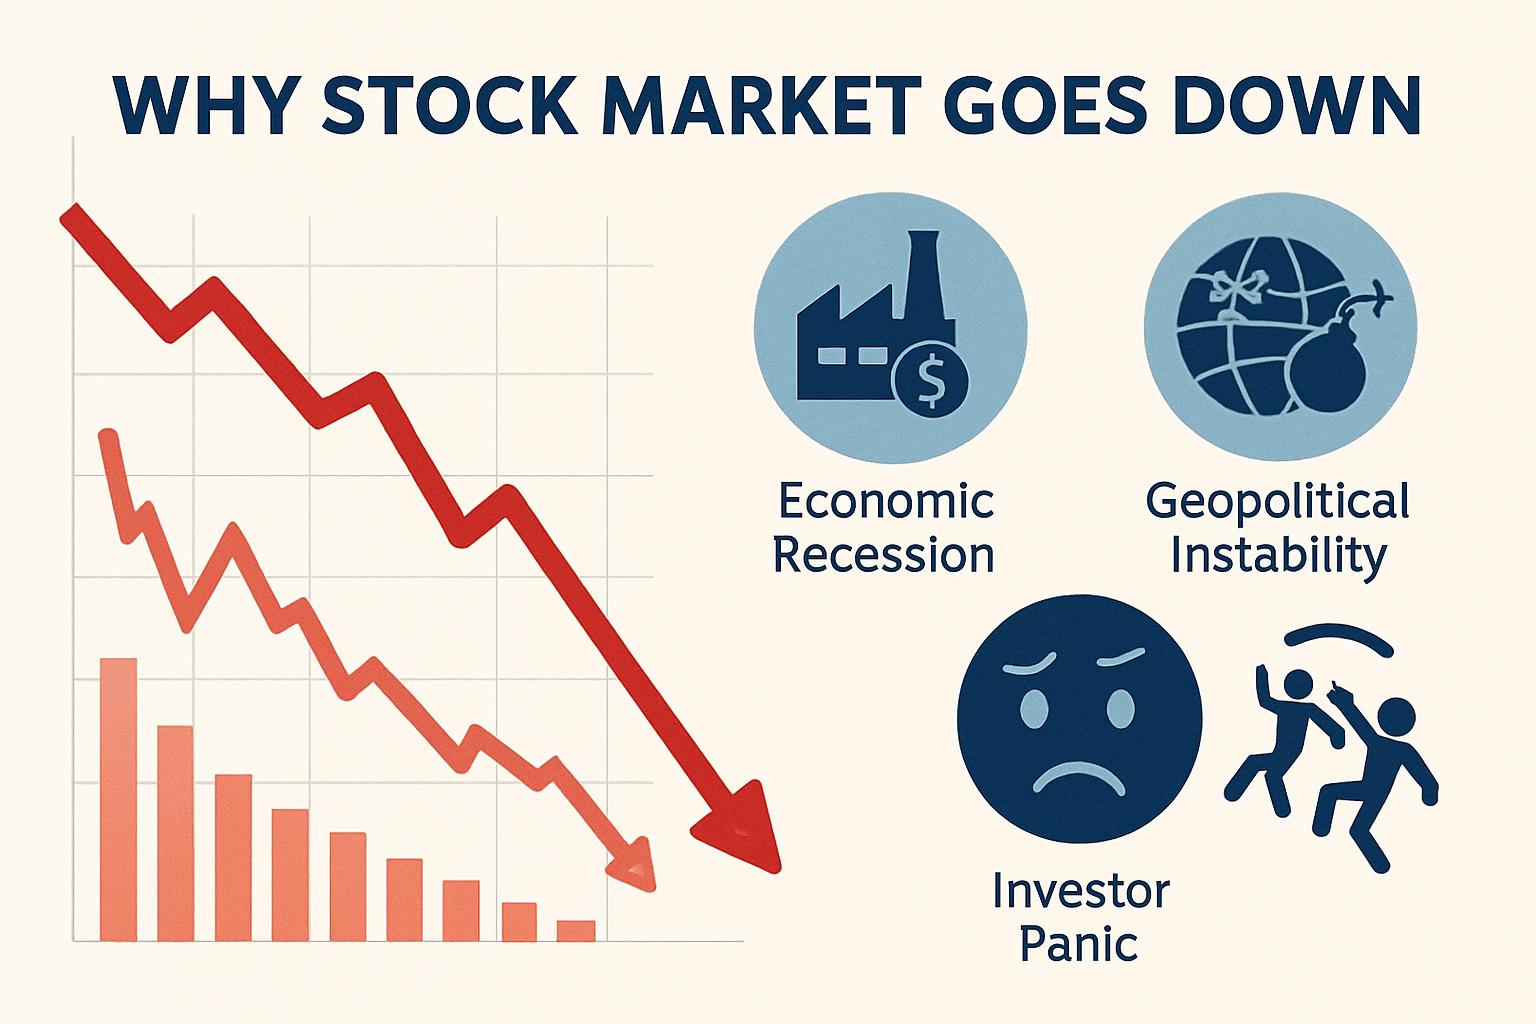
Geopolitical Tensions and Global Stability
Markets crave stability and predictability. Geopolitical conflicts—ranging from trade wars and tariffs to regional instabilities or full-scale military conflicts—introduce a layer of “black swan” risk. When global supply chains are threatened or energy prices spike due to international unrest, investors typically flee “risk-on” assets like stocks in favor of “safe havens” like gold or U.S. Treasuries. A sudden drop in the market is often a reflex reaction to a headline that threatens the status quo of global commerce.
Corporate Earnings and Sector-Specific Headwinds
While macro factors set the stage, the individual actors on that stage—the corporations—must perform. The stock market is ultimately a mechanism for discounting future cash flows. When those cash flows appear to be in jeopardy, prices adjust downward.
Missed Estimates and Lowered Guidance
Four times a year, publicly traded companies report their financial results. While the “beat or miss” of past quarterly earnings is important, the market is forward-looking. A company might report record profits but see its stock price tumble because management issued “weak guidance.” Guidance is the company’s own forecast for future performance. If a bellwether company in a major sector (like retail or technology) suggests that consumer demand is waning or that expenses are rising, it can drag down the entire sector and, eventually, the broader index.
Sector Rotations and Institutional Profit-Taking
Sometimes, a stock market drop isn’t a sign of economic doom, but rather a “rotation.” Institutional investors, such as hedge funds and pension funds, frequently move money out of sectors that have performed well (e.g., Tech) and into sectors they believe are undervalued (e.g., Energy or Utilities). If a specific sector that carries a heavy weight in the S&P 500 experiences significant profit-taking, it can make the entire market look like it is in a freefall, even if other parts of the economy remain stable.

The Impact of “Mega-Cap” Influence
In the modern market, a handful of companies—often referred to as the “Magnificent Seven” or “Mega-Caps”—account for a disproportionate share of the market’s total value. Because indices like the Nasdaq 100 are market-cap weighted, a 3% drop in one of these giants can pull the entire index down. When investors see the index dropping, they may begin selling their smaller holdings out of fear, creating a cascading effect that started with just a few massive corporations.
Psychological Triggers and Technical Market Dynamics
The market is not always a rational calculator; it is often a reflection of human behavior. Once a downward move begins, several technical and psychological factors can turn a minor dip into a significant drop.
Algorithmic Trading and “Sell-Off” Spirals
In the modern era, a vast majority of trading is executed by computers using complex algorithms. These bots are programmed to react to specific price triggers. For example, if the S&P 500 drops below a key “moving average” (a technical indicator), thousands of algorithms may trigger sell orders simultaneously. This automated selling can create a feedback loop where prices drop, triggering more sell orders, which causes prices to drop further, often far beyond what the fundamental news would justify.
Fear, Greed, and the VIX Index
Investor sentiment is a powerful force. The CBOE Volatility Index, or VIX, is often called the “Fear Gauge.” When the VIX spikes, it indicates that investors expect significant price swings and are buying “insurance” in the form of options. High levels of fear can lead to “capitulation,” where investors sell their holdings simply to stop the emotional pain of watching their portfolio value decline. This emotional selling often marks the “bottom” of a move, but during the process, it causes sharp, painful drops.
Technical Support Levels and Breakouts
Traders look at charts to identify “support levels”—price points where a stock or index has historically stopped falling and started rising. If the market “breaks” below a major support level, it signals to the trading community that the “bulls” have lost control and the “bears” are in charge. This technical breakdown often leads to a wave of selling from momentum traders who want to avoid being caught on the wrong side of a new downward trend.
Navigating the Downturn: Strategies for the Modern Investor
While a market drop is never pleasant, it is a natural part of the economic cycle. Historically, the stock market has spent more time going up than going down, but the “down” periods are often faster and more intense. The key to long-term success is how you respond to these days of red.
The Importance of Diversification
If your portfolio is dropping significantly more than the broad market, it may be a sign of poor diversification. A well-constructed portfolio includes a mix of different asset classes (stocks, bonds, real estate) and different sectors (defensive stocks like healthcare alongside growth stocks like tech). Diversification doesn’t prevent losses, but it can dampen the volatility, making it easier to stay the course emotionally during a market rout.
Dollar-Cost Averaging in a Volatile Market
For the long-term investor, a market drop can actually be an opportunity. Dollar-cost averaging (DCA) is the practice of investing a fixed amount of money at regular intervals, regardless of the price. When the market drops, your fixed investment buys more shares. Over time, this lowers your average cost per share. Rather than trying to “time the bottom,” which is nearly impossible, continuing your contributions during a downturn allows you to benefit when the market eventually recovers.
Maintaining a Long-Term Perspective
The most dangerous thing an investor can do on a day when stocks drop is to make a permanent decision based on a temporary move. It is helpful to zoom out on a stock chart. While a 2% drop in a single day feels significant, it often looks like a tiny blip on a five-year or ten-year chart. The stock market is a vehicle for wealth creation over decades, not days. If the fundamental reasons you bought an investment haven’t changed—if the company is still profitable, the management is still capable, and the product is still relevant—then a daily market drop is simply “noise” that should be ignored.
In conclusion, when you ask why did stocks drop today?, the answer is usually a complex blend of interest rate fears, corporate performance updates, and the mechanical realities of modern trading. By understanding these forces, you can strip away the mystery of market movements and replace fear with a disciplined, strategic approach to building wealth. Markets will always fluctuate, but the informed investor knows that time in the market is far more important than timing the market.
aViewFromTheCave is a participant in the Amazon Services LLC Associates Program, an affiliate advertising program designed to provide a means for sites to earn advertising fees by advertising and linking to Amazon.com. Amazon, the Amazon logo, AmazonSupply, and the AmazonSupply logo are trademarks of Amazon.com, Inc. or its affiliates. As an Amazon Associate we earn affiliate commissions from qualifying purchases.