
To the uninitiated, listening to a financial news broadcast can feel like deciphering a foreign language. Analysts frequently announce that the Dow Jones Industrial Average is “up 300 points” or that the S&P 500 “shed 50 points” in afternoon trading. For the novice investor, these figures often spark a fundamental question: What exactly is a point, and how does it translate into actual wealth or market health?
In the world of finance, a “point” is a shorthand unit of measure used to track the price movements of stocks, indices, and various other financial instruments. However, the value of a point is not universal; it changes depending on whether you are looking at an individual stock, a major market index, or interest rate fluctuations. Understanding these distinctions is crucial for anyone looking to navigate the markets with confidence and precision.
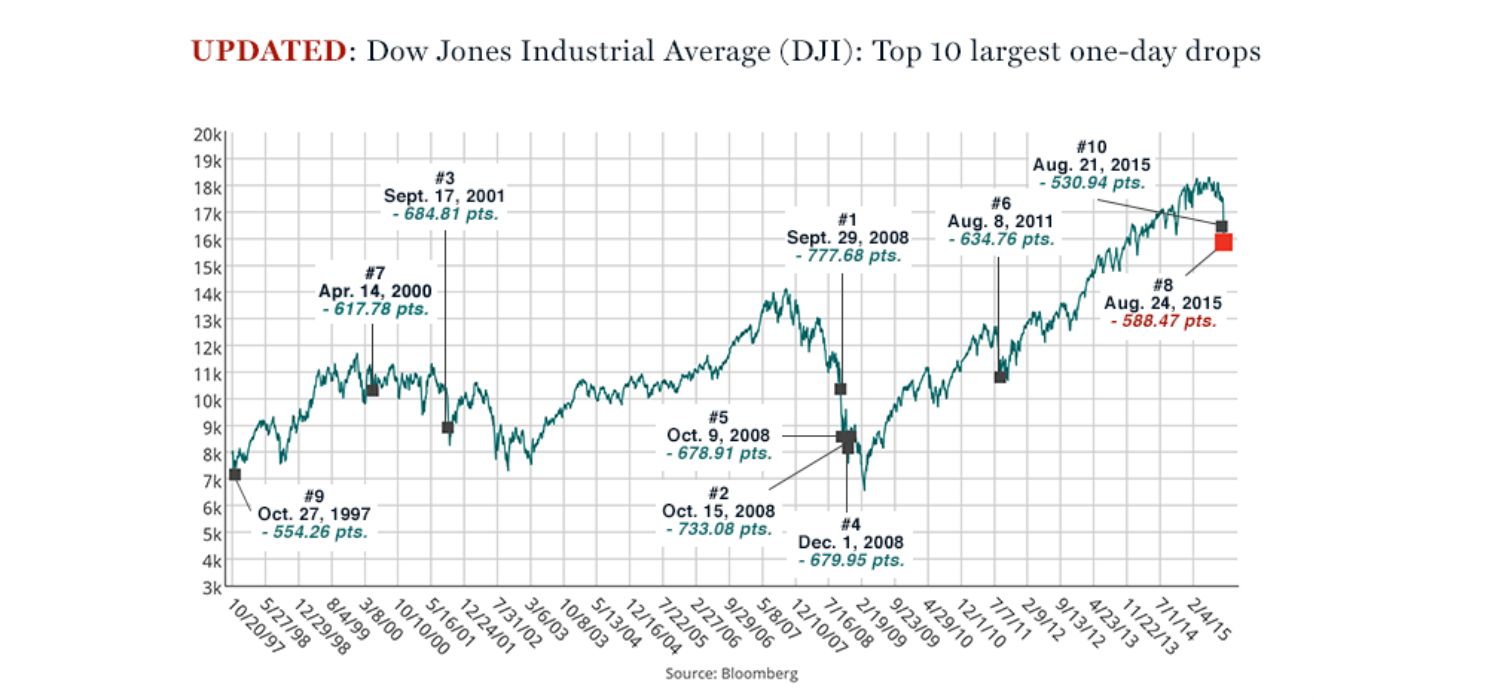
The Fundamental Definition: Points vs. Dollars
At its most basic level, a point is a measurement of change. However, its practical application varies significantly between individual securities and the broader indices that track them.
Points in Individual Stocks
For an individual stock listed on a major exchange, the definition of a point is straightforward: one point equals one U.S. dollar. If a financial analyst says a stock has gained three points, it simply means the share price has increased by $3.00.
While this seems simple, the significance of a one-point move depends entirely on the stock’s current price. For a “penny stock” trading at $2.00, a one-point move represents a massive 50% increase in value. Conversely, for a high-priced “blue chip” stock trading at $3,000 per share, a one-point move is negligible—a mere 0.033% fluctuation. This highlights why professional investors rarely look at point changes in isolation, preferring instead to evaluate price movements through the lens of percentage change.
Points in Market Indices
When we talk about the “market” being up or down in points, we are usually referring to major indices like the Dow Jones Industrial Average (DJIA), the S&P 500, or the Nasdaq Composite. In this context, a point is not a dollar. Instead, it is a unit representing a weighted average of the prices of the stocks within that index.
Because indices like the S&P 500 are composed of hundreds of different stocks with varying prices and market capitalizations, the “point” becomes an abstract figure used to represent the collective movement of those stocks. A 100-point move in the Dow does not mean that every stock in the index went up by a certain dollar amount; rather, it indicates that the aggregate value of the index, as calculated by its specific formula, has shifted by that amount.
The Mechanics of Market Indices: How Points are Calculated
To understand what a point means in an index, one must understand how those indices are constructed. There are two primary methods used by major benchmarks: price-weighting and market-capitalization weighting.
The Dow Jones and Price-Weighting
The Dow Jones Industrial Average is a price-weighted index consisting of 30 prominent companies. In a price-weighted system, companies with higher stock prices have a greater influence on the index’s point value than companies with lower stock prices.
To calculate the Dow’s point value, the prices of all 30 stocks are added together and then divided by the “Dow Divisor.” The divisor is a constantly adjusted number that accounts for corporate actions like stock splits, spin-offs, and dividends. Because of this structure, if a high-priced stock like UnitedHealth Group moves significantly, it will cause a much larger point swing in the Dow than a similar move by a lower-priced component like Coca-Cola, regardless of the companies’ actual market sizes.
The S&P 500 and Market-Cap Weighting
Unlike the Dow, the S&P 500 and the Nasdaq are market-capitalization-weighted indices. This means that the influence of a stock on the index’s point value is determined by its total market value (share price multiplied by the number of shares outstanding).
In these indices, a point represents a slice of the total market value of all included companies. Therefore, a massive company like Apple or Microsoft has a far greater impact on the index’s points than a smaller company at the bottom of the list. When these tech giants see their stock prices move, the S&P 500 index points react accordingly, reflecting the massive shift in capital those movements represent.
The Role of the Index Divisor
Whether price-weighted or market-cap weighted, every index uses a mathematical constant known as a divisor to ensure continuity. Without a divisor, a simple stock split—where a company doubles its shares and halves its price—would cause the index to “crash” in points, even though the actual value of the company hasn’t changed. The divisor is adjusted to “neutralize” these events, ensuring that point changes reflect actual market performance rather than administrative changes.
Understanding Basis Points (BPS) in Finance
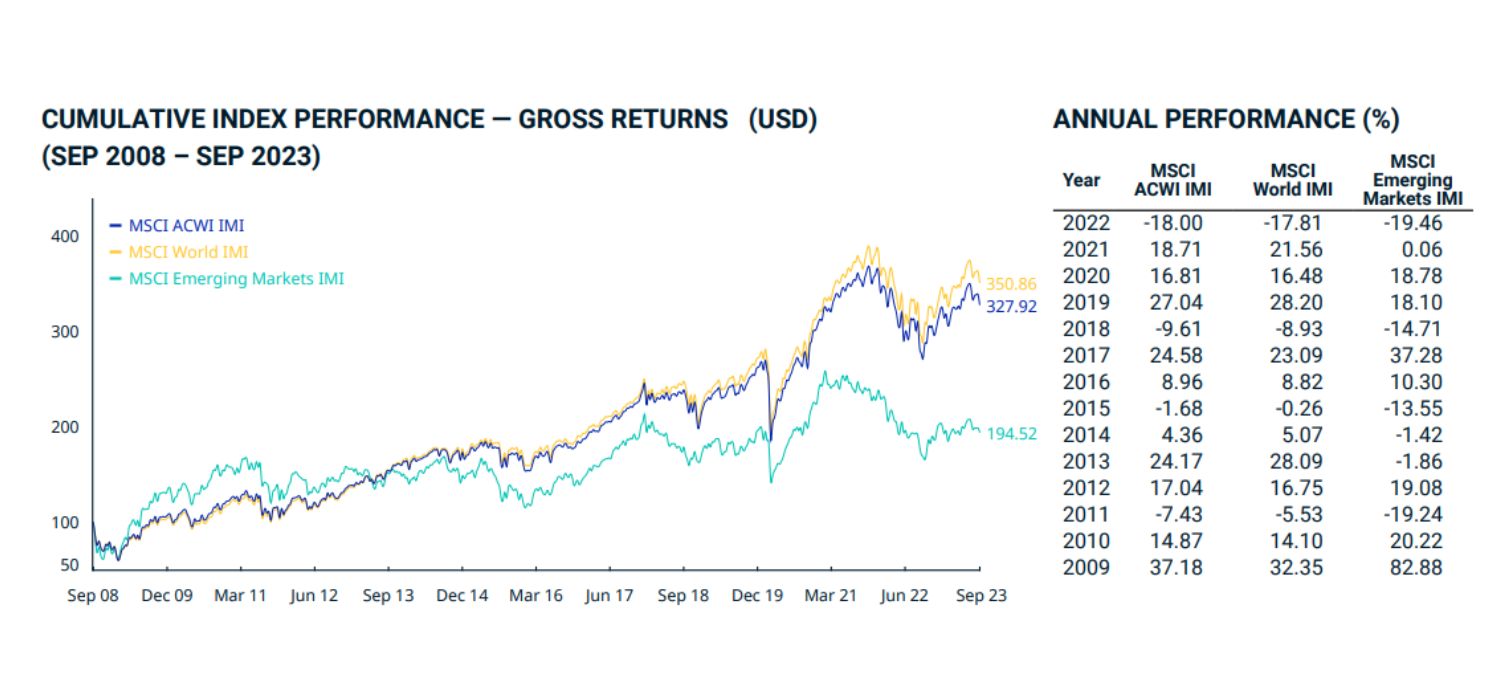
While equity markets deal in standard points, the worlds of fixed income, central banking, and lending operate using “basis points,” often referred to in the industry as “bps” or “bips.”
Defining the Basis Point
A basis point is equal to one-hundredth of one percent (0.01%). Therefore, 100 basis points equal 1%. This granular measurement is necessary because in the world of interest rates and bond yields, even a tiny fraction of a percent can represent billions of dollars in shifted value.
If the Federal Reserve announces that it is raising interest rates by 50 basis points, it is increasing the rate by 0.50%. If a mortgage rate moves from 6.25% to 6.35%, it has increased by 10 basis points.
Why Basis Points Matter to Investors
Basis points provide a clear, unambiguous way to discuss changes in yields and interest rates. Using percentages can sometimes be confusing; for instance, if an interest rate of 10% increases by “1%,” does that mean it is now 11% (an additive increase) or 10.1% (a proportional increase)? By using basis points, financial professionals eliminate this ambiguity. An increase of 100 basis points always means the rate moves from 10% to 11%.
The Psychological Impact and Media Headlines
One of the most important things for an investor to understand is the difference between the “headline number” (points) and the “real movement” (percentages). The media often uses point changes because they sound more dramatic, which captures audience attention.
The Volatility Trap
A “500-point drop in the Dow” sounds catastrophic. However, the significance of 500 points depends entirely on the index’s total level. In the early 1980s, when the Dow was trading around 1,000 points, a 500-point drop would have been a 50% wipeout of the market—an unprecedented national disaster.
In today’s market, with the Dow hovering near 40,000 points, a 500-point drop is approximately a 1.25% decline. While not a “good” day, it is a relatively common occurrence in the world of investing and certainly not a reason for panic. Investors who focus on points rather than percentages often fall victim to emotional trading, reacting to the perceived magnitude of a large number rather than the actual statistical significance of the move.
Historical Context and “Point” Inflation
As the stock market grows over decades, the value of a single point effectively “inflates.” This makes historical point-to-point comparisons largely useless. To compare the “Black Monday” crash of 1987 to modern market corrections, one must look at the percentage decline. On that day, the Dow fell 508 points, which represented a staggering 22.6% loss. To see a similar percentage loss today, the Dow would have to drop nearly 9,000 points in a single session.
Advanced Applications: Points in Options and Futures
For those who move beyond standard stock trading into derivatives, the definition of a point changes once again, often becoming a direct multiplier for profit and loss.
Contract Multipliers
In the futures market, a point move has a specific dollar value assigned to it, known as the “tick value” or contract multiplier. For example, in the E-mini S&P 500 futures contract, a one-point move is worth $50. If a trader buys a contract and the index moves up 10 points, the trader gains $500 (10 points x $50).
Options Pricing
In the options market, points are often used to describe the “premium” or the price of the option. If an option is trading at 5 points, and the contract represents 100 shares of the underlying stock (which is standard), the actual cost to the investor is $500 ($5.00 x 100).
In these sophisticated markets, points are used to standardize trading across different assets, allowing traders to quickly calculate their exposure and potential risk.

Conclusion: Developing a “Percentage First” Mindset
For the modern investor, the key to financial literacy is learning to translate points into percentages instantly. While points are the primary language of the evening news and the “ticker” at the bottom of the screen, they are often a poor indicator of an investment’s true performance or the market’s overall health.
By understanding that a point is a dollar for a stock, a weighted unit for an index, and a hundredth of a percent for interest rates, you gain a clearer picture of the financial landscape. More importantly, by focusing on the percentage change, you can cut through the noise of sensationalist headlines and make more rational, data-driven decisions for your portfolio. Whether the market moves 10 points or 1,000, your focus should always remain on the relative impact on your capital and your long-term financial goals.
aViewFromTheCave is a participant in the Amazon Services LLC Associates Program, an affiliate advertising program designed to provide a means for sites to earn advertising fees by advertising and linking to Amazon.com. Amazon, the Amazon logo, AmazonSupply, and the AmazonSupply logo are trademarks of Amazon.com, Inc. or its affiliates. As an Amazon Associate we earn affiliate commissions from qualifying purchases.