
The final trading session of the week often serves as a barometer for investor sentiment, acting as a bridge between the data-heavy work week and the speculative silence of the weekend. When investors ask “what did the stock market do Friday,” they are rarely looking for a simple recitation of numbers. Instead, they are seeking to understand the underlying narrative: Did the market close with a confident rally, suggesting a bullish start to the coming week? Or did a late-day sell-off indicate that institutional players were de-risking in anticipation of weekend headlines? Friday’s market action is a unique intersection of economic data, psychological shifts, and institutional rebalancing.
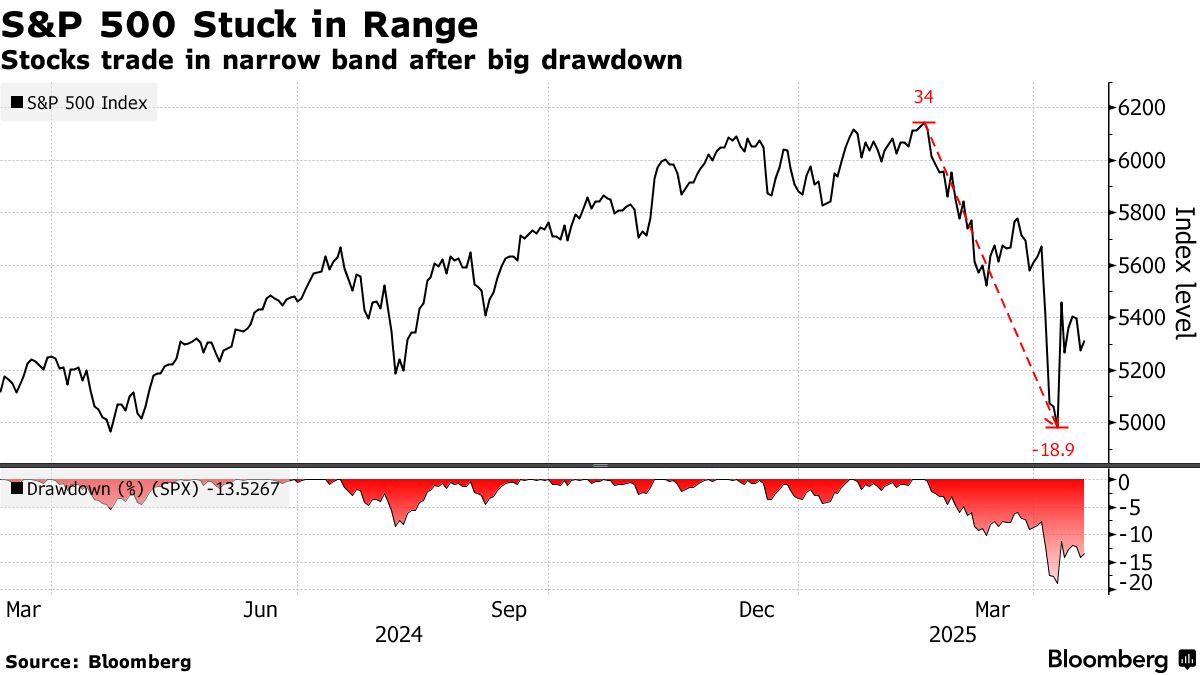
Understanding the nuances of Friday’s performance requires looking beyond the headline figures of the Dow Jones Industrial Average, the S&P 500, and the Nasdaq Composite. It involves dissecting sector-specific movements, analyzing the influence of the bond market, and interpreting how recent economic indicators—from inflation reports to employment figures—have been baked into the closing prices.
Decoding Friday’s Market Movements: The Numbers and the Sentiment
The performance of the major indices on any given Friday provides a snapshot of the broader financial landscape. Typically, a Friday session is characterized by a “weekly close” mentality. For many professional traders and fund managers, the Friday closing price is the most significant data point of the week, as it determines the weekly candlestick on technical charts and influences the positioning of portfolios for the following Monday.
Key Index Performance and Volatility
When the S&P 500 experiences a late-Friday surge, it often signifies “smart money” accumulation. Conversely, a “Friday Fade,” where stocks lose their gains in the final hour of trading, can suggest a lack of conviction among participants to hold positions over the two-day break. Volatility, often measured by the VIX (Volatility Index), frequently fluctuates on Fridays as traders hedge their bets. If the VIX rises while the market stays flat or dips, it indicates an increasing demand for “insurance” against potential negative news over the weekend.
Trading Volume and Liquidity
Friday volume can be erratic. On most weeks, volume might thin out as the afternoon progresses and traders head for the exits. However, on “Triple Witching” Fridays—which occur four times a year when options and futures contracts expire simultaneously—volume can skyrocket to record highs. These sessions are often chaotic and may not reflect the actual fundamental health of the market, but rather the mechanical necessity of closing out derivatives positions. Identifying whether a Friday was a high-volume conviction day or a low-volume “drift” is essential for any investor trying to gauge the true strength of a market trend.
Sector Standouts: Who Led the Charge and Who Lagged?
The stock market is not a monolith; it is a collection of eleven distinct sectors, each reacting differently to the prevailing economic climate. On a typical Friday, the internal “rotation” of capital tells a story about where investors believe the economy is headed.
Growth vs. Value Dynamics
In recent sessions, the tug-of-war between growth stocks (primarily technology and consumer discretionary) and value stocks (financials, energy, and industrials) has dominated the Friday narrative. When the Nasdaq outperforms the Dow, it suggests an appetite for risk and a belief that interest rates might be stabilizing. Growth stocks are highly sensitive to the “discount rate”—when long-term yields fall on a Friday, tech companies often see a valuation boost. Conversely, if the market’s gains are led by defensive sectors like Utilities and Consumer Staples, it indicates a “risk-off” environment where investors are seeking shelter.
The Role of Interest Rates and Treasury Yields
The bond market is the engine room of the financial system, and its Friday behavior often dictates stock performance. Treasury yields, particularly the 10-year note, are watched with hawk-like precision. If yields spike on a Friday following a hot economic report, the equity market often recoils, as higher yields make stocks relatively less attractive and increase borrowing costs for corporations. A Friday where both stocks and bonds rally is often a sign of “goldilocks” sentiment—investors believing that growth is steady but inflation is cooling.
The Influence of Economic Indicators and Corporate Earnings
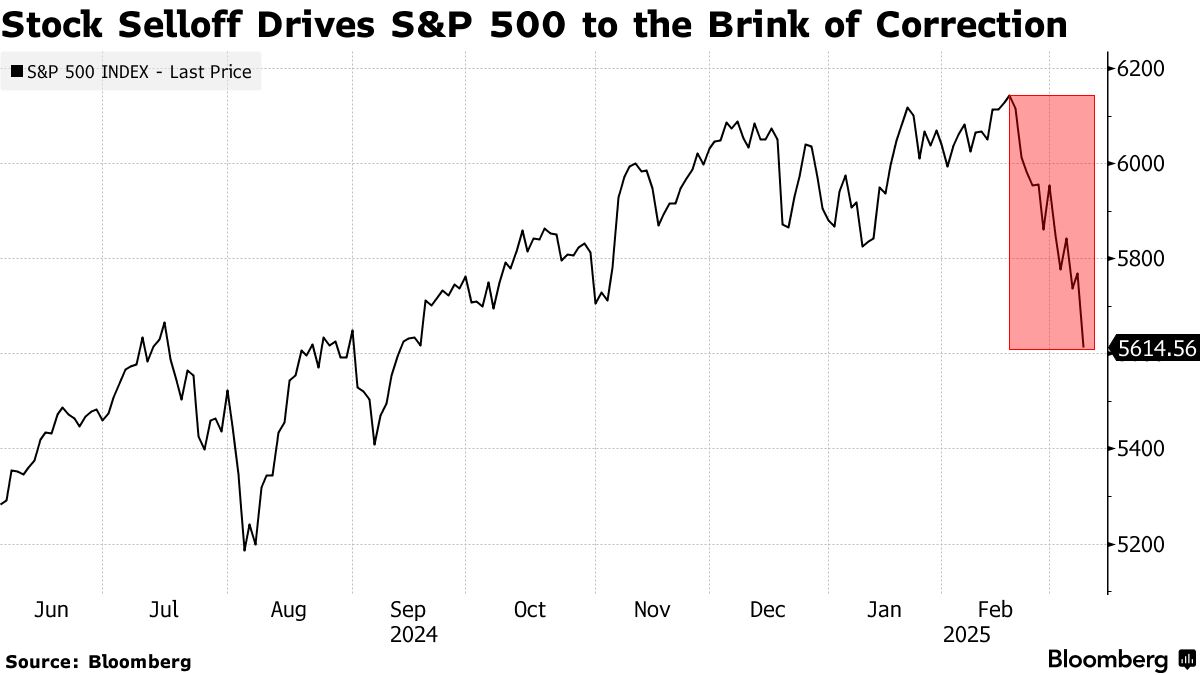
Friday is frequently the day when the U.S. government releases its most impactful data, most notably the Monthly Employment Situation report (the Jobs Report) from the Bureau of Labor Statistics.
Impact of the Jobs Report and Inflation Data
The “First Friday” of every month is a landmark event for the stock market. A stronger-than-expected jobs report can be a double-edged sword: it proves the economy is resilient, but it also signals to the Federal Reserve that they may need to keep interest rates higher for longer to prevent overheating. This often leads to a “good news is bad news” reaction in the markets, where a strong labor market triggers a sell-off in stocks. Understanding Friday’s market action often boils down to how the market interpreted the morning’s data dump.
Earnings Season and Institutional Rebalancing
During the peak of earnings season, Friday performance is heavily influenced by the reports released after Thursday’s close or before Friday’s open. Large-cap tech earnings or major banking results can single-handedly shift the direction of the S&P 500. Beyond individual earnings, Friday is also a day for institutional rebalancing. Large pension funds and mutual funds often execute trades at the end of the week to align their portfolios with their target allocations. This institutional flow can create price action that seems disconnected from the news cycle but is actually driven by the mechanical realities of fund management.
Psychological Factors: Why Fridays Dictate Monday’s Open
The psychology of the market on a Friday is distinct from any other day of the week. This is largely due to the “weekend risk”—the reality that major geopolitical events, bank failures, or policy shifts can occur when the markets are closed and investors are unable to react.
The “Weekend Effect” and Risk Management
Professional traders often follow a rule of thumb: “Never go home long (bullish) and wrong.” If a Friday starts with a rally but news begins to sour, the selling can accelerate as the closing bell approaches because no one wants to be caught with an exposed position over the weekend. This creates a feedback loop where the fear of a Monday “gap down” (when the market opens significantly lower than it closed) causes a Friday afternoon sell-off.
Retail vs. Institutional Behavior
Fridays also highlight the contrast between retail investors and institutional “market makers.” Retail investors might be tempted to “buy the dip” late on a Friday, hoping for a Monday bounce. Meanwhile, institutional players are often more focused on “delta-neutral” strategies or ensuring their books are balanced. Understanding this dynamic helps investors see that a Friday drop isn’t always a sign of a crashing economy; sometimes, it is simply the professional class tidying up their accounts before taking a break.
Strategizing for the Week Ahead: Lessons from Friday’s Close
For the long-term investor and the disciplined trader, Friday’s market action provides the necessary data to build a strategy for the following week.
Technical Analysis and Weekly Charts
Technical analysts look at the “weekly candle” that is completed at 4:00 PM EST on Friday. A “hammer” candle or a “bullish engulfing” pattern on a weekly chart is far more significant than the same pattern on a daily chart. It represents a week’s worth of consensus. If the stock market finished Friday at its weekly high, it suggests strong momentum and a high probability of continued gains. If it finished at its weekly low, it indicates that the bears are in control and further downside may be imminent.
Long-term Investing vs. Short-term Noise
It is vital for personal finance enthusiasts to distinguish between “noise” and “signal.” A 1% drop on a Friday might feel significant, but in the context of a 20-year retirement plan, it is often just noise. However, if Friday’s action was driven by a fundamental shift—such as a change in Federal Reserve policy or a major shift in corporate guidance—it becomes a signal that requires a portfolio review.
In conclusion, what the stock market did Friday is the culmination of a week’s worth of economic data, corporate news, and human emotion. By analyzing the closing numbers, the sector performance, and the underlying economic drivers, investors can gain a clearer picture of the financial landscape. Whether the market closed in the green or the red, the “Friday finish” sets the stage for the next cycle of the global economy, providing the insights needed to navigate the complexities of personal finance and professional investing.
aViewFromTheCave is a participant in the Amazon Services LLC Associates Program, an affiliate advertising program designed to provide a means for sites to earn advertising fees by advertising and linking to Amazon.com. Amazon, the Amazon logo, AmazonSupply, and the AmazonSupply logo are trademarks of Amazon.com, Inc. or its affiliates. As an Amazon Associate we earn affiliate commissions from qualifying purchases.