
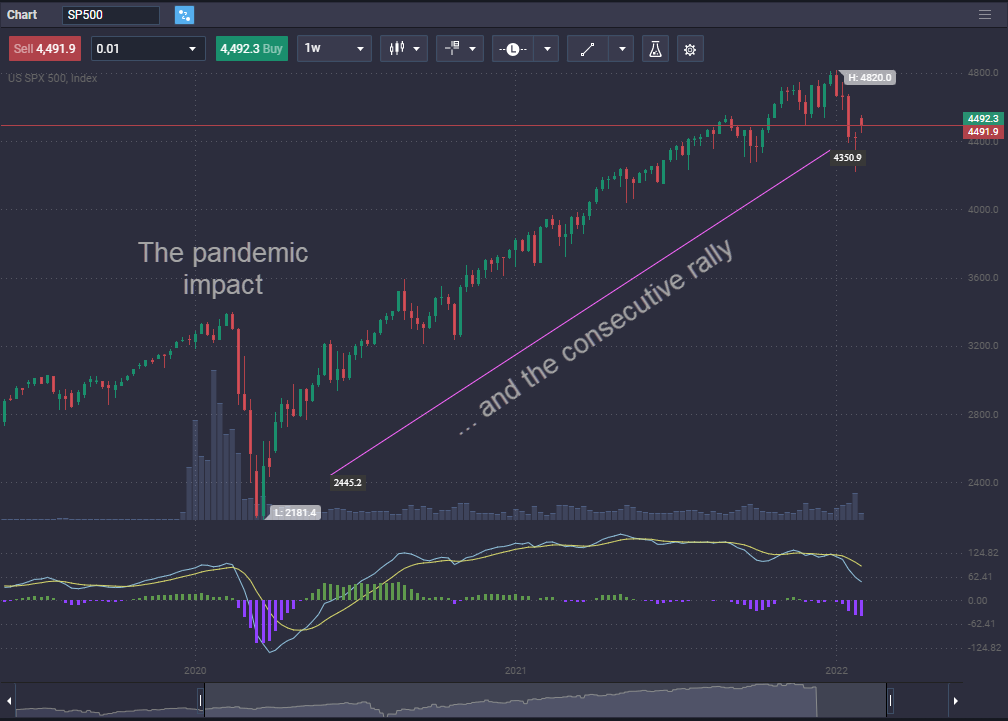
The S&P 500 is often cited as the definitive barometer of the American economy. Comprising 500 of the largest publicly traded companies in the United States, it represents approximately 80% of the total market capitalization of the U.S. stock market. For traders and investors, the S&P 500 offers a unique blend of liquidity, diversification, and volatility that makes it one of the most popular instruments in the financial world. Whether you are a long-term investor looking to build wealth over decades or a day trader seeking to capitalize on intraday swings, understanding how to navigate this index is essential.
Understanding the Foundations of the S&P 500
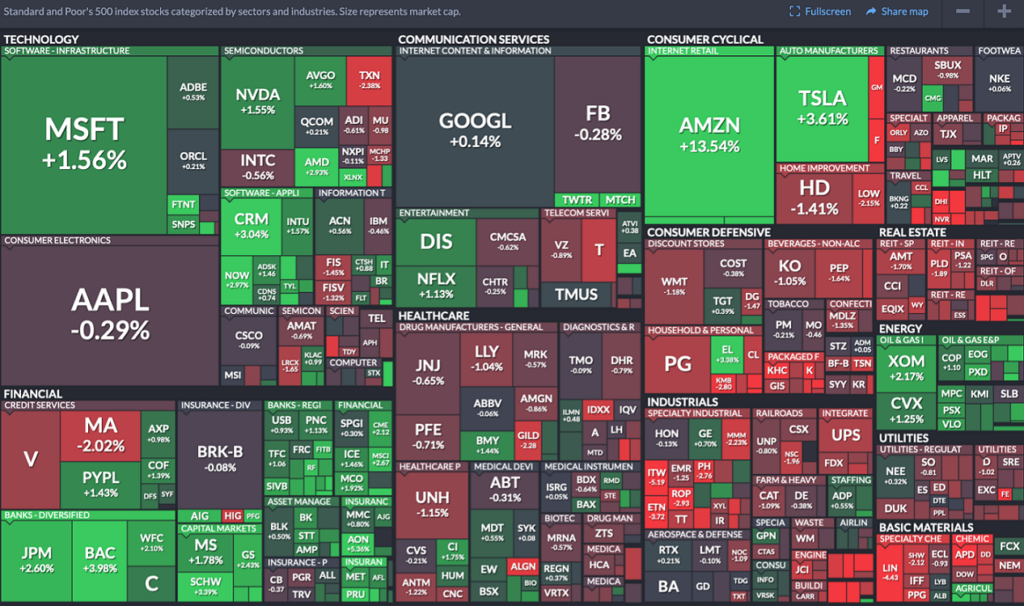
Before placing a trade, it is crucial to understand what you are actually trading. The S&P 500 is a float-adjusted market-capitalization-weighted index. This means that companies with higher market valuations, such as Apple, Microsoft, and Amazon, have a more significant impact on the index’s movement than smaller components.
The Composition and Weighting of the Index
Unlike the Dow Jones Industrial Average, which is price-weighted, the S&P 500’s movement is dictated by the collective market value of its constituents. In recent years, the index has become increasingly concentrated in the technology sector, particularly among the “Magnificent Seven” tech giants. When trading the S&P 500, you are not just trading “the market”; you are often trading the performance of high-growth technology and consumer services companies. Understanding this weighting is vital because a major news event affecting a single top-ten company can move the entire index, even if the other 490 stocks remain flat.
Why Trade the S&P 500?
The primary draw of the S&P 500 is its high liquidity. Because so many market participants—from retail investors to massive pension funds—trade this index, the bid-ask spreads are typically very tight. This reduces the cost of entry and exit. Additionally, the index offers built-in diversification. By trading the S&P 500, you are inherently protected against the total failure of a single company, as the index rebalances quarterly to remove underperformers and add rising stars.
Choosing the Right Financial Instruments
You cannot trade the S&P 500 index directly because it is a mathematical calculation, not an asset. Instead, you must use financial vehicles that track its performance. The choice of instrument depends on your capital, risk tolerance, and time horizon.
Exchange-Traded Funds (ETFs)
For most individual traders and long-term investors, ETFs are the gold standard. ETFs like the SPDR S&P 500 ETF Trust (SPY), the iShares Core S&P 500 ETF (IVV), and the Vanguard S&P 500 ETF (VOO) are designed to mirror the index’s price action almost perfectly.
-
SPY: This is the most liquid ETF in the world, making it ideal for active traders who need to move in and out of positions quickly.
-
VOO and IVV: These typically offer lower expense ratios, making them more suitable for buy-and-hold investors who want to minimize management fees over several years.
Futures and Micro-Futures
For those seeking leverage and 24-hour market access, the futures market is the primary venue. The E-mini S&P 500 (ES) is a staple for professional traders. However, for those with smaller accounts, the Micro E-mini (MES) offers the same benefits at one-tenth the size. Futures allow you to profit from both rising and falling markets with ease, but they carry significant risk due to the inherent leverage involved. Unlike stocks, futures have expiration dates and require a margin account.
Options on the S&P 500
Options provide the most flexibility, allowing traders to hedge existing portfolios or speculate on volatility. You can trade options on the SPY ETF or “Cash-Settled” index options (SPX). SPX options offer certain tax advantages under Section 1256 of the IRC and eliminate the risk of early assignment, which is a critical consideration for advanced strategy builders using credit spreads or iron condors.
Analytical Strategies for Market Timing
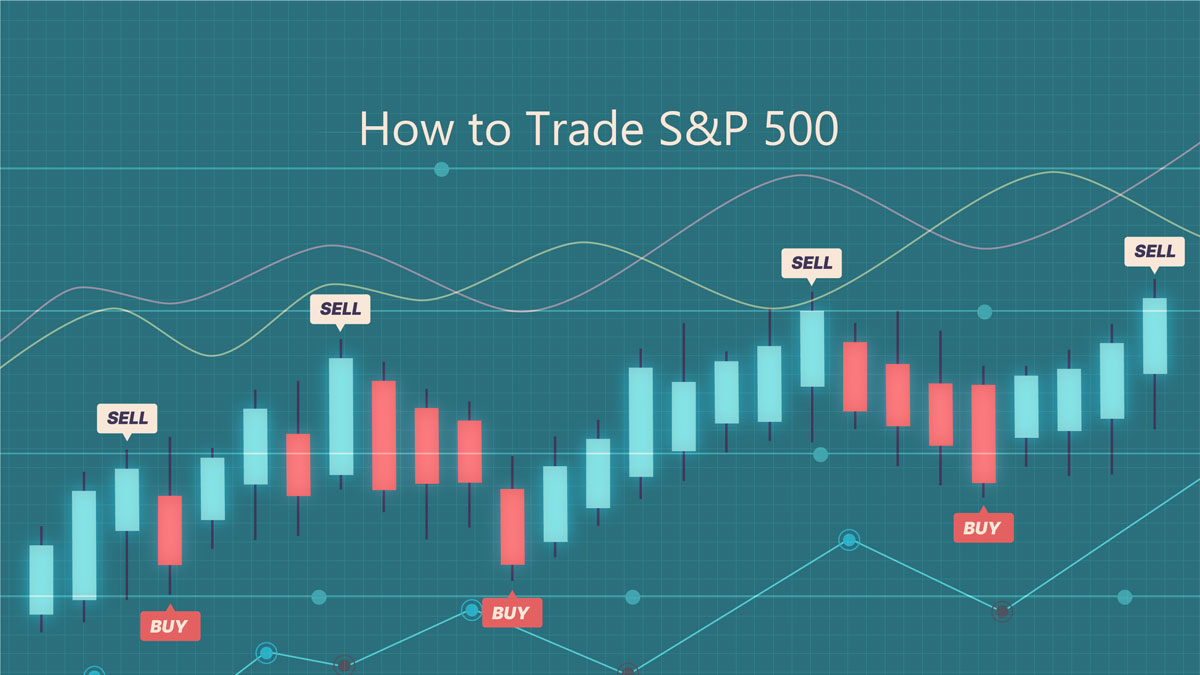
To trade the S&P 500 successfully, you must combine macroeconomic awareness with technical precision. The index does not move in a vacuum; it responds to interest rate changes, corporate earnings, and geopolitical shifts.
Fundamental Analysis and Macro Indicators
The S&P 500 is highly sensitive to the Federal Reserve’s monetary policy. When the Fed raises interest rates, borrowing costs for companies increase, and the discount rate applied to future earnings rises, often leading to a decline in index prices.
-
Earnings Season: Quarterly reports from the top-weighted companies (like Alphabet or Nvidia) serve as major catalysts for index volatility.
-
Economic Data: Keep a close eye on the Consumer Price Index (CPI) for inflation trends and Non-Farm Payroll (NFP) reports for labor market health. Strong economic data can sometimes be “bad news” for the market if it suggests the Fed will keep interest rates higher for longer.
Technical Analysis and Key Levels
Technical traders focus on price action and historical patterns. Because the S&P 500 is so widely watched, technical levels often become self-fulfilling prophecies.
-
Moving Averages: The 50-day and 200-day simple moving averages (SMA) are the most watched levels. When the index is above its 200-day SMA, the long-term trend is considered bullish.
-
Support and Resistance: Traders identify “psychological” levels, such as whole numbers (e.g., 4,500 or 5,000). These often act as areas where buying or selling pressure intensifies.
-
The VIX Correlation: The CBOE Volatility Index (VIX), often called the “fear gauge,” typically moves inversely to the S&P 500. A spiking VIX often signals a bottoming process in the S&P 500, while a complacent, low VIX may suggest the market is overextended.
Risk Management and the Psychology of Trading
Trading the S&P 500 requires a disciplined approach to risk. Even the most accurate technical setup can fail in the face of an unexpected news event or a sudden shift in market sentiment.
Position Sizing and Stop Losses
One of the most common mistakes beginners make is over-leveraging. In the S&P 500, volatility can result in “gaps”—where the market opens significantly lower or higher than it closed the previous day.
-
The 1% Rule: Never risk more than 1% of your total account equity on a single S&P 500 trade.
-
Using Stop Losses: Always have a predetermined exit point. For index traders, placing stops below key structural supports (like the previous week’s low) can prevent a standard pullback from turning into a catastrophic loss.
Managing Volatility and Emotional Bias
The S&P 500 is prone to “bull traps” and “bear traps.” During periods of high volatility, the index may whip-saw back and forth, hitting stop-loss orders on both sides of the trade. Professional traders often wait for “confirmation”—such as a candle closing above a resistance level—rather than jumping in at the first touch. Developing a neutral psychological stance is essential. The market does not care about your entry price; it only moves based on the aggregate flow of capital.
Getting Started: A Step-by-Step Operational Roadmap
If you are ready to begin trading the S&P 500, you must follow a systematic process to ensure your operational setup is as professional as your strategy.
Step 1: Select a Brokerage
Choose a broker that aligns with your preferred instrument. If you are trading ETFs, a standard discount brokerage with zero-commission stock trades is ideal. If you are pursuing futures or complex options strategies, you may need a specialized platform that offers robust margin capabilities and low latency execution.
Step 2: Develop a Trading Plan
A trading plan should be a written document that defines:
-
Your Timeframe: Are you day trading (minutes to hours), swing trading (days to weeks), or position trading (months to years)?
-
Entry Criteria: What specific technical or fundamental triggers must occur before you enter?
-
Exit Criteria: How will you take profits, and where will you cut losses?
Step 3: Paper Trading and Backtesting
Before risking real capital, use a simulator to “paper trade” the S&P 500. This allows you to get a feel for the index’s rhythm and how different financial instruments react to price changes. Backtesting your strategy against historical data from previous market cycles (such as the 2008 crash or the 2020 recovery) will give you a statistical understanding of your strategy’s win rate and drawdown potential.
Step 4: Continuous Education
The S&P 500 is dynamic. As the global economy evolves, the sectors that lead the index change. In the 1980s, energy and industrials dominated; today, it is technology and communications. Staying informed about the shifting weight of sectors and the impact of emerging technologies like AI on the index’s largest constituents will ensure your trading strategy remains relevant.
Trading the S&P 500 is a journey of constant refinement. By focusing on the right instruments, applying disciplined risk management, and maintaining a deep understanding of macroeconomic drivers, you can navigate this powerhouse of the financial markets with confidence and precision. Whether the market is trending upward in a long-term bull run or experiencing the turbulence of a correction, the S&P 500 provides the tools necessary for financial success for those prepared to master its nuances.
aViewFromTheCave is a participant in the Amazon Services LLC Associates Program, an affiliate advertising program designed to provide a means for sites to earn advertising fees by advertising and linking to Amazon.com. Amazon, the Amazon logo, AmazonSupply, and the AmazonSupply logo are trademarks of Amazon.com, Inc. or its affiliates. As an Amazon Associate we earn affiliate commissions from qualifying purchases.