
For many investors, the first ritual of the morning—often before the first cup of coffee is finished—is checking the pulse of the financial world. The question “How much is the stock market up today?” is more than a simple inquiry into numerical change; it is a search for sentiment, a pulse check on the global economy, and a way to gauge the health of personal retirement accounts and brokerage portfolios. However, understanding the answer requires looking beyond a single green or red percentage. It necessitates a deep dive into the indices that define “the market,” the catalysts that drive daily price action, and the psychological framework required to navigate the inherent volatility of the financial landscape.
The Pulse of the Market: How to Interpret Daily Fluctuations
When people ask how much the market is up, they are typically referring to the performance of one of the major benchmarks. Because there is no single “stock market,” investors rely on indices to provide a snapshot of specific segments of the economy. Understanding these benchmarks is the first step in contextualizing daily performance.
Decoding the Major Indices: S&P 500, Dow, and Nasdaq
The S&P 500 is widely considered the most accurate representation of the US stock market. Comprising 500 of the largest publicly traded companies, it is a market-capitalization-weighted index. When the S&P 500 is up 1%, it signals broad-based strength across various sectors, from technology and healthcare to consumer staples and energy. Because of its diversity, it is the primary benchmark for institutional investors.
In contrast, the Dow Jones Industrial Average (DJIA) consists of only 30 “blue-chip” companies. Unlike the S&P 500, the Dow is price-weighted, meaning stocks with higher share prices have a greater influence on the index’s movement. While it is the most famous index historically, it is often viewed as a narrower lens through which to view the market. If the Dow is up significantly while other indices are flat, it usually indicates that industrial or traditional value stocks are outperforming growth-oriented companies.
The Nasdaq Composite is the third pillar, heavily weighted toward the technology and telecommunications sectors. This index is the primary indicator of the “growth” side of the market. On days when the Nasdaq is up more than the Dow, it suggests that investors are in a “risk-on” mood, favoring innovation and high-potential tech stocks over established, dividend-paying entities.
The Role of Real-Time Data and Market Sentiment
Daily market movements are often driven by sentiment—the collective mood of millions of investors reacting to information in real-time. This sentiment is reflected in the “bid-ask spread” and the volume of trades being executed. When a market is “up,” it signifies that buyers are more aggressive than sellers, willing to pay higher prices based on the expectation of future value. Conversely, a “down” day reflects a consensus that current prices may be overextended or that new risks have emerged.
Factors Driving Today’s Market Performance
A stock market that moves up 1.5% in a single session doesn’t do so in a vacuum. Various macroeconomic and microeconomic catalysts act as the engines behind these fluctuations. Identifying which engine is running helps an investor understand if the day’s gains are sustainable or merely a “dead cat bounce.”
Economic Indicators and Central Bank Policy
Perhaps the most significant driver of daily market movement in the modern era is the Federal Reserve. Investors hang on every word of the Fed Chair, looking for clues regarding interest rate trajectories. When the market is up, it often follows a report suggesting that inflation is cooling or that the Fed may pause rate hikes. Lower interest rates generally lead to higher stock prices because they reduce the cost of borrowing for companies and make the future cash flows of growth stocks more valuable.
Key economic reports, such as the Consumer Price Index (CPI) for inflation and the monthly Non-Farm Payrolls for employment, are high-volatility events. A “goldilocks” report—one that shows a steady but not overheating economy—often triggers a broad market rally.
Corporate Earnings and Sector-Specific Movement
While macro data sets the stage, individual company performance provides the script. We are often in “earnings season” four times a year, during which the largest corporations report their quarterly financial health. If a bellwether company like Apple, Microsoft, or Nvidia reports earnings that exceed analyst expectations and provides “upward guidance” (a positive outlook for the future), it can lift the entire sector and, by extension, the broader indices.
Sector rotation also plays a role. On a day where the S&P 500 is up, it might be driven entirely by a surge in energy prices lifting oil stocks, or perhaps a breakthrough in pharmaceutical research boosting healthcare. Professional investors look at “market breadth”—the number of individual stocks advancing versus those declining—to see if the rally is healthy and broad or narrow and fragile.
The Psychology of Daily Gains and Losses
For the individual investor, the daily movement of the market is as much a psychological challenge as it is a financial one. The digital age has made it possible to track portfolios in real-time, which can lead to emotional decision-making that undermines long-term goals.

Avoiding the Trap of Short-Term Volatility
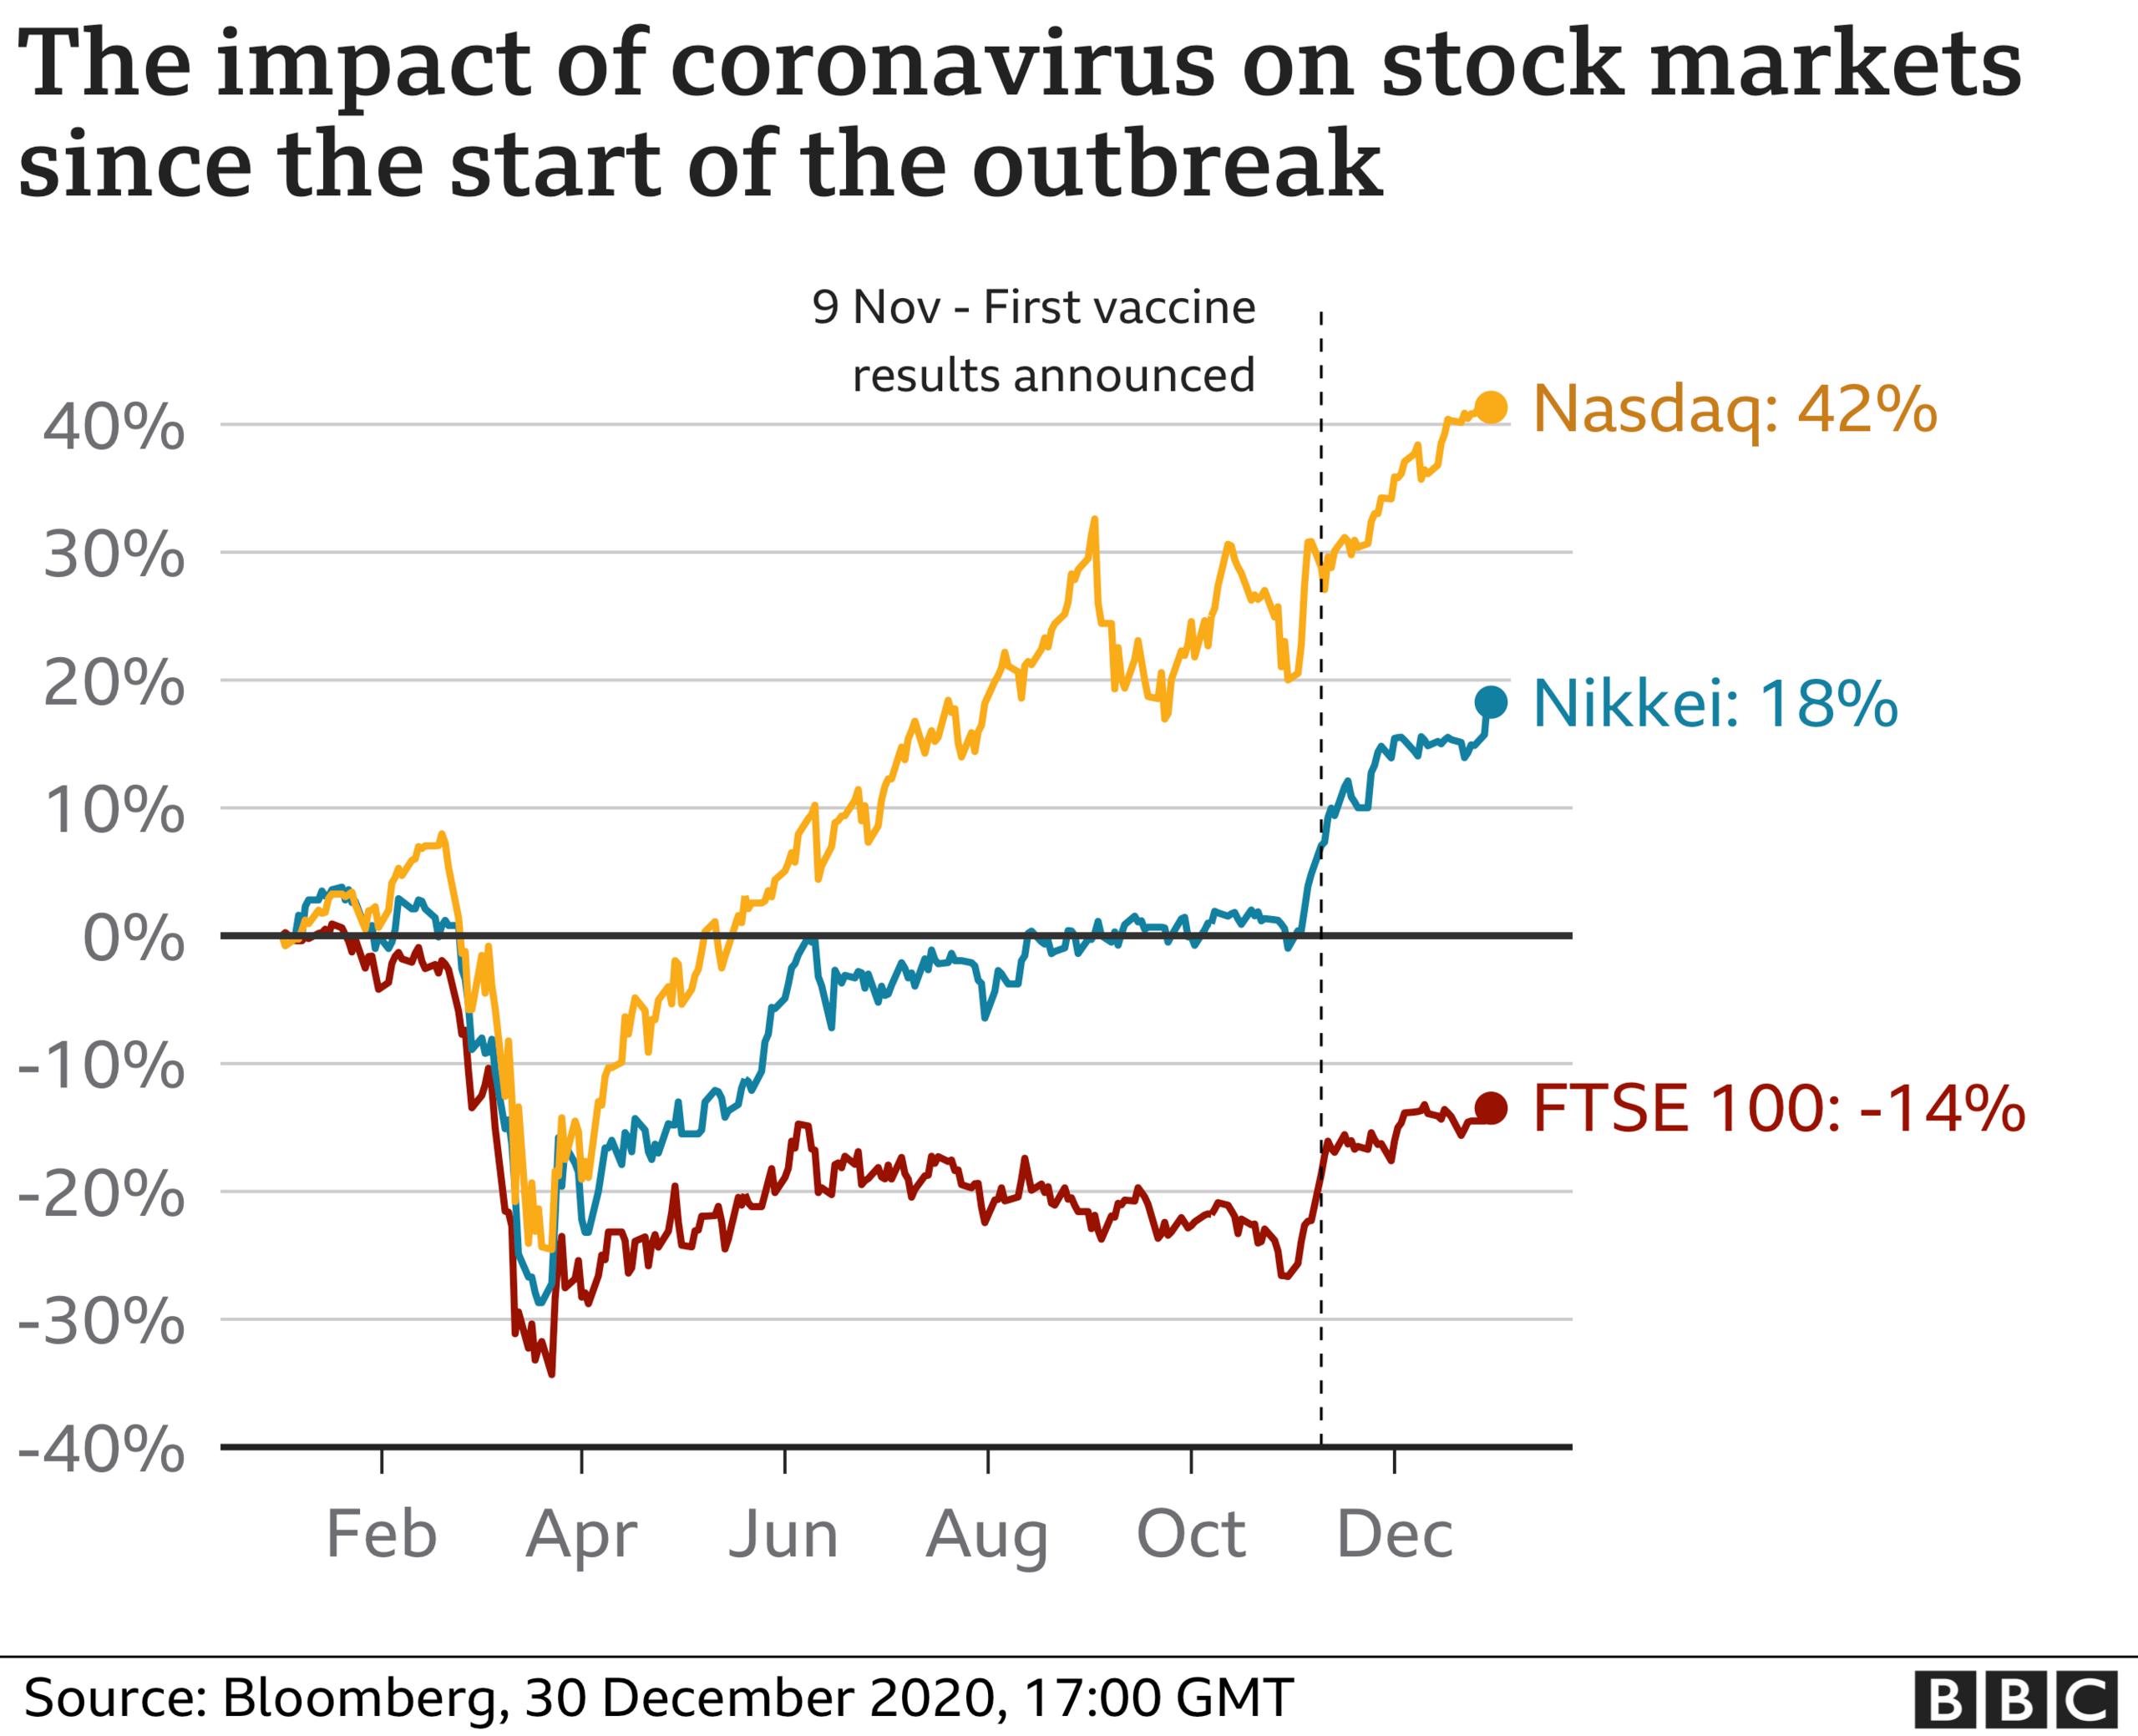
One of the most dangerous phrases in investing is “This time is different.” When the market is up significantly, investors often feel the “Fear of Missing Out” (FOMO), leading them to buy at the peak. When the market is down, “loss aversion”—the psychological pain of losing money being twice as potent as the joy of gaining it—often leads to panic selling.
Successful wealth management requires a “dispassionate” view of daily fluctuations. A 1% gain today is statistically insignificant in the context of a thirty-year investment horizon. Understanding that the market is a “voting machine” in the short term but a “weighing machine” in the long term (as Benjamin Graham famously said) helps investors stay the course during periods of high volatility.
The Impact of High-Frequency and Algorithmic Trading
It is also important to recognize that much of the daily movement in today’s market is not driven by humans at all. High-frequency trading (HFT) and algorithmic models account for a massive percentage of daily volume. These programs are designed to trade on micro-second price discrepancies and technical patterns. Often, a sharp move “up” or “down” is exacerbated by these algorithms hitting “stop-loss” orders or “buy triggers.” For the personal financier, this means that daily price action is often “noise” created by machines rather than a fundamental shift in the value of the companies they own.
Strategic Asset Allocation in a Moving Market
Knowing how much the market is up today is only useful if it informs a sound financial strategy. Instead of reacting to the daily news cycle, seasoned investors use market movements to validate or adjust their overarching asset allocation.
Rebalancing During Upward Trends
When the market experiences a prolonged “up” trend, a portfolio can become “tilted.” For example, if you began with a target allocation of 60% stocks and 40% bonds, a major stock market rally might push your equity exposure to 70%. While this feels good because your balance is growing, it also increases your risk profile beyond your original comfort level. Professional financial planning involves periodic rebalancing—selling a portion of the “winners” (stocks) and buying more of the “underperformers” (bonds or cash) to maintain a consistent risk level.
The Power of Dollar-Cost Averaging (DCA)
For those building wealth through side hustles, online income, or corporate salaries, the daily movement of the market should be secondary to the consistency of contributions. Dollar-cost averaging—investing a fixed amount of money at regular intervals regardless of the share price—is a strategy that thrives on volatility. When the market is “up,” your fixed investment buys fewer shares; when the market is “down,” it buys more. Over time, this lowers the average cost per share and removes the stress of trying to “time the market” based on daily fluctuations.
Beyond the “Daily Green”: Building a Resilient Portfolio
While the question “How much is the market up today?” provides immediate feedback, long-term financial success is built on the foundation of resilience and diversification. The market’s daily performance is a single data point in a vast ocean of financial history.
Long-Term Growth vs. Day-to-Day Speculation
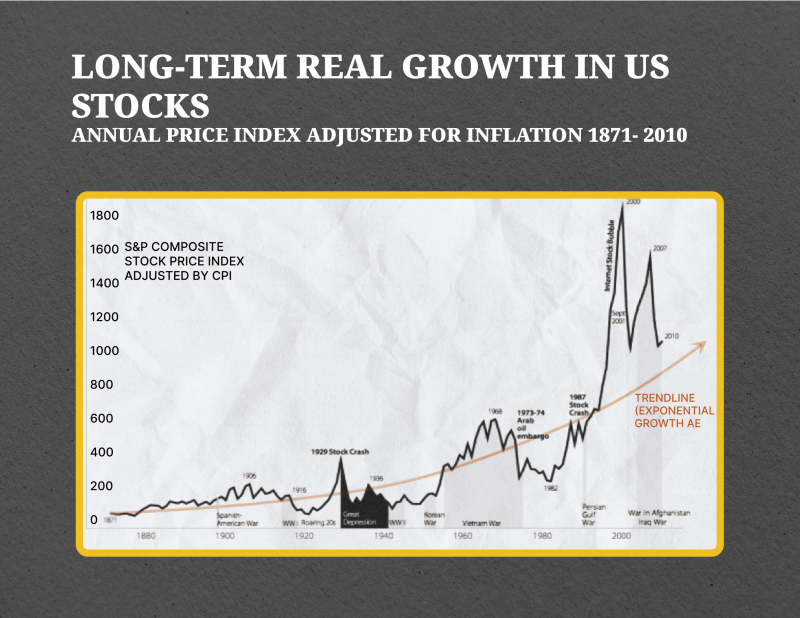
Since its inception, the US stock market has trended upward, averaging an annual return of approximately 10% before inflation. However, that average is composed of years where the market was up 30% and years where it was down 20%. The investors who achieve their financial goals—whether that is early retirement, funding education, or building a legacy—are those who focus on “time in the market” rather than “timing the market.”
A resilient portfolio is one that is diversified across sectors, geographies, and asset classes. It includes not just large-cap US stocks, but international equities, small-cap companies, fixed-income securities, and perhaps alternative investments like real estate or commodities. When you are diversified, “how much the market is up” becomes a more nuanced conversation, as different parts of your portfolio will react differently to the day’s news.
Tools for Monitoring Market Health
In the modern financial era, investors have access to professional-grade tools to monitor the market. Beyond the basic price charts, metrics like the VIX (Volatility Index), often called the “Fear Gauge,” can tell you how much volatility professional traders expect over the next 30 days. High VIX levels often coincide with market bottoms, while low levels can signal complacency.
Additionally, looking at the “Price-to-Earnings” (P/E) ratio of the S&P 500 can help determine if the market being “up” today is making stocks expensive or if they are simply recovering to a fair valuation.
Conclusion
The stock market’s daily movement is a fascinating interplay of global economics, corporate performance, and human psychology. While it is natural to want to know if the market is up today, the most successful investors use that information as a backdrop rather than a directive. By understanding the indices, recognizing the drivers of growth, and maintaining a disciplined, long-term strategy, you can transform daily market noise into a clear path toward financial independence. Whether the screen is green or red today, the principles of sound investing remain the same: stay diversified, stay disciplined, and keep your eyes on the horizon.
aViewFromTheCave is a participant in the Amazon Services LLC Associates Program, an affiliate advertising program designed to provide a means for sites to earn advertising fees by advertising and linking to Amazon.com. Amazon, the Amazon logo, AmazonSupply, and the AmazonSupply logo are trademarks of Amazon.com, Inc. or its affiliates. As an Amazon Associate we earn affiliate commissions from qualifying purchases.