
In the world of high-stakes finance, few questions are asked more frequently than “How much is the Dow up today?” For the casual observer, the Dow Jones Industrial Average (DJIA) is a simple thermometer for the U.S. economy. For the seasoned investor, it is a complex, price-weighted index that reflects the health of thirty of the most influential “blue-chip” companies in the United States. Understanding why the Dow moves, how those movements are calculated, and what a “green” day means for your personal portfolio is essential for navigating modern financial markets.
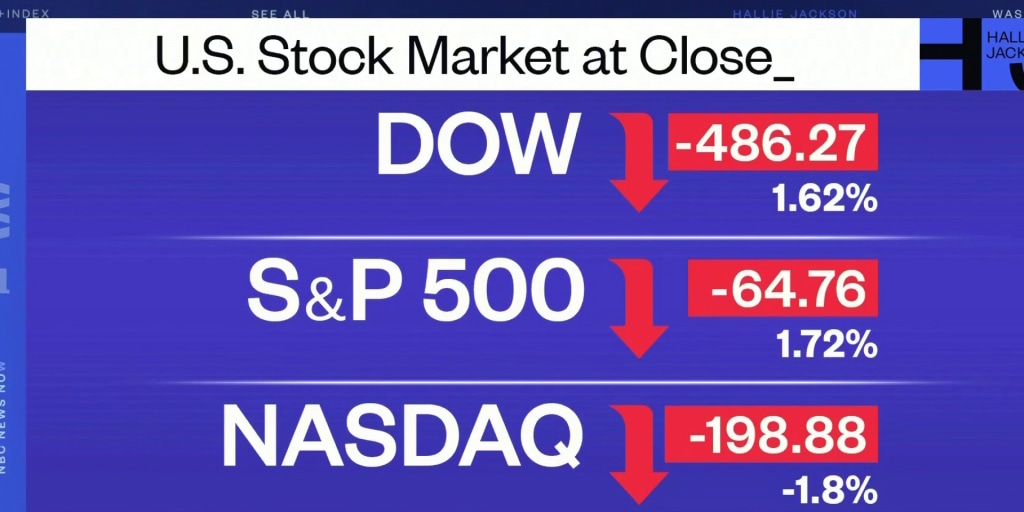
When the Dow is “up,” it typically signals a wave of investor optimism, driven by positive corporate earnings, favorable economic data, or shifts in monetary policy. However, the raw point total—whether it is up 100 points or 500 points—only tells part of the story. To truly grasp the significance of daily market shifts, one must look beneath the surface of the headlines.
The Anatomy of the Dow Jones Industrial Average
To understand daily performance, one must first understand the mechanics of the index itself. Established in 1896 by Charles Dow and Edward Jones, the DJIA was originally intended to track the performance of the industrial sector. Today, it has evolved to include a diverse array of sectors, ranging from technology and healthcare to financial services and consumer goods.
A Price-Weighted Methodology
Unlike the S&P 500 or the Nasdaq Composite, which are market-capitalization-weighted, the Dow is price-weighted. This means that companies with a higher stock price per share have a greater influence on the index’s daily movement than companies with lower stock prices. For example, a 5% move in a stock trading at $500 per share will move the Dow significantly more than a 5% move in a stock trading at $50 per share, regardless of the companies’ actual market valuations.
This methodology is often criticized by modern economists for being antiquated, yet it remains the most quoted financial metric in the world. Because the index only tracks 30 companies, it is often seen as a snapshot of “Corporate America” rather than a comprehensive view of the entire stock market.
The Role of the Dow Divisor
A common point of confusion for investors is why the Dow doesn’t simply add up the prices of the 30 stocks and divide by 30. The reason is the “Dow Divisor.” Over decades, companies undergo stock splits, spin-offs, and other structural changes. To ensure that a 2-for-1 stock split doesn’t cause the index to “crash” overnight, the divisor is adjusted. Today, the divisor is a decimal much smaller than one, meaning that a $1 change in any component stock translates into a much larger point move for the index.
Why the Dow Moves: Identifying the Daily Drivers
When you check your financial apps and see the Dow is up, it is usually the result of a specific catalyst or a combination of macroeconomic factors. Market volatility is rarely random; it is a reaction to new information being “priced in” by millions of traders globally.
Corporate Earnings Reports
Four times a year, during “earnings season,” the Dow’s movement is largely dictated by the quarterly reports of its 30 components. If heavyweights like Microsoft, Apple, or Goldman Sachs report profits that exceed analyst expectations, the index can see a massive upward swing. Conversely, even if 25 of the companies are performing well, a disastrous earnings report from a high-priced component like UnitedHealth Group can pull the entire index into the red.
Federal Reserve Policy and Interest Rates
Perhaps the most significant driver of daily market movement in the current era is the Federal Reserve. Investors hang on every word from the Fed Chair. When the Fed signals a “dovish” stance—suggesting that interest rates may be lowered or held steady—the Dow often rallies. Lower interest rates reduce the cost of borrowing for corporations and make stocks more attractive relative to bonds. If the Dow is up today, there is a high probability that recent inflationary data was cooler than expected, leading investors to bet on a more lenient central bank.
Global Geopolitics and Macro Trends
The Dow is not an island. Because its component companies are multinational giants, they are highly sensitive to global events. Trade agreements, foreign conflicts, and international supply chain shifts can all spark a rally. For instance, a resolution in a trade dispute between the U.S. and a major trading partner can lead to an immediate “relief rally,” causing the Dow to jump as investors breathe a sigh of relief.

Deciphering “Up” and “Down” Beyond the Point Total
When the news reports that “the Dow is up 400 points,” it sounds like a monumental gain. However, professional investors focus on percentages rather than points. As the Dow reaches higher absolute levels—such as 35,000 or 40,000—a 400-point move represents a smaller percentage change than it did when the index was at 10,000.
Percentage Change vs. Point Change
A 1% move is the standard benchmark for a “significant” daily shift. If the Dow is at 38,000, a 380-point gain is exactly 1%. In a historical context, a 500-point drop in 1987 would have been a total market collapse (Black Monday), whereas today, a 500-point move is just another volatile Tuesday. Understanding this distinction helps investors maintain perspective and avoid emotional reactions to large numbers.
The “Wealth Effect” and Market Sentiment
There is a psychological component to the Dow being up. Known as the “wealth effect,” when investors see their 401(k)s and brokerage accounts increasing in value, they feel more confident. This confidence often leads to increased consumer spending, which in turn boosts the economy. This creates a feedback loop: a rising Dow encourages spending, which boosts corporate profits, which further pushes the Dow upward.
Digital Tools for Real-Time Financial Analysis
In the digital age, you no longer have to wait for the evening news to know how the market performed. Financial technology has democratized access to data, allowing retail investors to see exactly why the Dow is moving in real-time.
Heat Maps and Sector Performance
One of the most effective tools for understanding “how much the Dow is up” is the market heat map. These visual tools show the 30 components of the Dow as blocks of color—green for gains and red for losses. The size of the block usually represents the company’s influence. By looking at a heat map, an investor can instantly see if the Dow is up because of a broad-based rally or if it is being carried by a single sector like Technology or Energy.
Real-Time Financial Aggregators
Platforms like Bloomberg, CNBC, and Yahoo Finance provide more than just the current number. They provide “attribution,” showing exactly how many points each company contributed to the day’s total. If the Dow is up 200 points, these tools might show that Boeing contributed 50 points of that gain due to a new aircraft contract, while the other 29 companies moved marginally.
Long-Term Strategy in a Short-Term World
While checking the daily status of the Dow is a common habit, it is important to distinguish between “market noise” and “market trends.” Daily fluctuations are often driven by high-frequency trading algorithms and short-term speculation. For the long-term investor, the answer to “how much is the Dow up today” is often less important than the answer to “where is the Dow headed over the next decade?”
The Dangers of Market Timing
Trying to trade based on daily movements is a recipe for volatility in one’s personal finances. Markets are “forward-looking,” meaning they often react to events before they even happen. By the time a retail investor sees the Dow is up and decides to buy, the “easy money” has often already been made. Professional financial advisors generally suggest a strategy of Dollar Cost Averaging (DCA), where you invest a set amount of money at regular intervals regardless of whether the Dow is up or down.

The Value of Diversification
Because the Dow only tracks 30 companies, it should never be the sole barometer for a personal investment strategy. A healthy financial plan involves exposure to small-cap stocks, international markets, and bonds. While the Dow provides a professional and insightful look at the giants of industry, the broader S&P 500 or the Total Stock Market Index often provides a more accurate reflection of a diversified portfolio’s health.
In conclusion, “how much the Dow is up today” is a window into the current collective psyche of the global financial community. It reflects a blend of corporate success, economic policy, and investor emotion. By understanding the price-weighted nature of the index, the influence of the Federal Reserve, and the difference between points and percentages, you can transform a simple daily statistic into a powerful tool for financial literacy and long-term wealth building. Whether the market is in a bull run or a temporary retreat, staying informed is the first step toward financial mastery.
aViewFromTheCave is a participant in the Amazon Services LLC Associates Program, an affiliate advertising program designed to provide a means for sites to earn advertising fees by advertising and linking to Amazon.com. Amazon, the Amazon logo, AmazonSupply, and the AmazonSupply logo are trademarks of Amazon.com, Inc. or its affiliates. As an Amazon Associate we earn affiliate commissions from qualifying purchases.