
When investors ask, “How far down is the stock market?” they are typically seeking one of two things: a measurement of the current distance from recent all-time highs or a historical benchmark to determine if the “bottom” is near. In the world of finance, this measurement is known as a drawdown. Understanding how far the market has fallen—and how far it potentially has to go—is a fundamental skill for anyone managing a portfolio, whether you are a seasoned day trader or a long-term retirement saver.
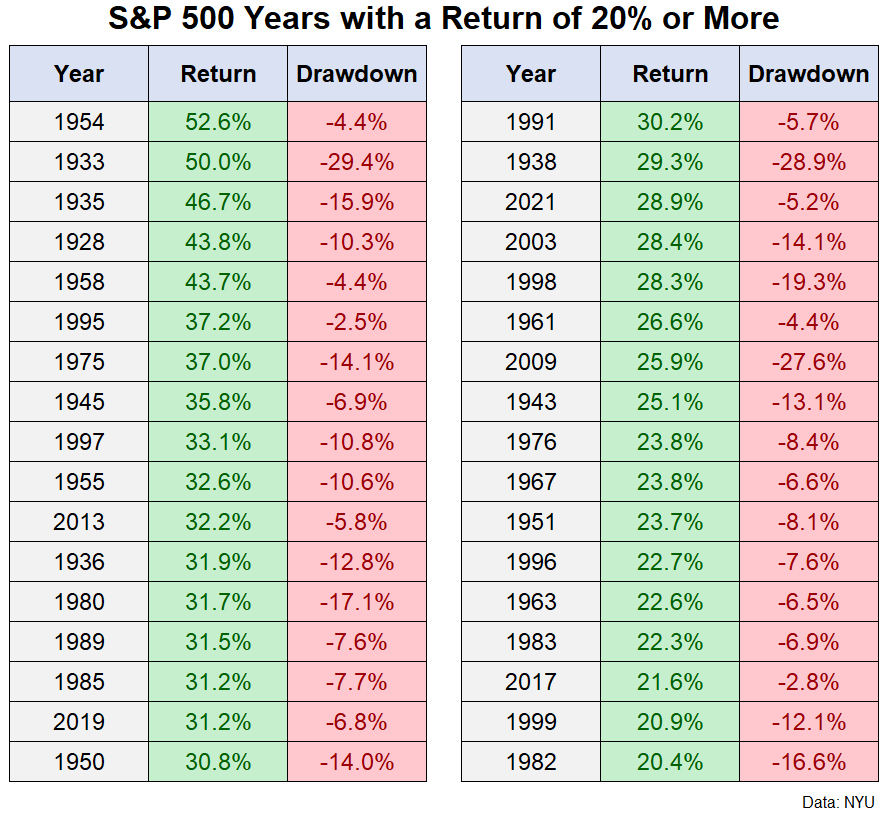
The stock market does not move in a straight line. Volatility is the price of admission for the higher returns that equities provide compared to “risk-free” assets like Treasury bonds. However, when the red numbers begin to dominate the headlines, the psychological toll can lead to impulsive decision-making. By quantifying market declines and placing them in a historical context, investors can transition from emotional reactions to calculated strategic moves.
Measuring the Depth: Indices, Bear Markets, and Corrections
To answer how far down the market is, one must first define which “market” is being discussed. The performance of the S&P 500, which tracks 500 of the largest U.S. companies, often serves as the primary proxy for the “market.” However, the tech-heavy Nasdaq Composite or the blue-chip Dow Jones Industrial Average can tell very different stories depending on the economic climate.
The Difference Between a Correction and a Bear Market
Financial analysts use specific terminology to categorize the severity of a decline. A “correction” is officially defined as a drop of 10% or more from a recent peak. Corrections are remarkably common; historically, they occur about once a year on average. They are often viewed as “healthy” resets that prevent the market from becoming overextended or “frothy.”
A “bear market,” on the other hand, is a more serious event, defined by a decline of 20% or more from the most recent high. Bear markets are typically associated with broader economic issues, such as high inflation, rising interest rates, or an impending recession. While corrections are short-term blips, bear markets can last for months or even years, testing the resolve of even the most disciplined investors.
Tracking the Major Benchmarks
Not all sectors fall at the same rate. When the market is “down,” it is often lopsided.
-
The S&P 500: As a market-cap-weighted index, it is heavily influenced by giant technology and healthcare firms. When these sectors stumble, the entire market feels the weight.
-
The Nasdaq Composite: Because this index is weighted toward growth and technology, it tends to fall further and faster during periods of rising interest rates. In a downturn, the Nasdaq might be down 30% while the broader market is only down 15%.
-
The Dow Jones Industrial Average: Composed of 30 “mature” companies, the Dow often proves more resilient during downturns, as investors flock to the safety of established dividends and stable earnings.
Historical Context: How Deep Have Markets Fallen Before?
To understand if the current market is “low,” we must look at how far down it has gone in the past. History does not repeat itself exactly, but it often rhymes. By looking at the “Greatest Hits” of market crashes, we can see the range of possibilities for a downward trend.
Lessons from the 2008 Financial Crisis and the Dot-Com Bubble
The two most significant drawdowns of the 21st century provide a sobering look at the “worst-case” scenario. During the Dot-Com crash (2000–2002), the S&P 500 fell roughly 49%, while the Nasdaq plummeted a staggering 78% as speculative tech valuations evaporated. This was a “valuation-driven” crash.
In contrast, the 2008 Global Financial Crisis was a “systemic” crash. The S&P 500 dropped approximately 56% from its peak. In both instances, the market didn’t just drop 20%; it cut portfolios in half. These events represent the extreme end of the spectrum, usually triggered by a fundamental breakdown in the global financial architecture or an unprecedented bubble.
The 2020 Pandemic Crash and Rapid Recoveries
Not all deep drops are long-lasting. In early 2020, the onset of the COVID-19 pandemic caused the fastest 30% drop in history. However, because of massive government stimulus and a rapid shift in consumer behavior, the recovery was equally swift. This serves as a reminder that the “depth” of a market drop does not always dictate the “duration” of the recovery. An investor who panicked and sold at the -30% mark missed one of the most aggressive bull runs in history that followed just weeks later.
The Psychology of the Downward Trend

The hardest part of navigating a market that is “down” isn’t the math; it’s the mindset. Loss aversion—the psychological phenomenon where the pain of losing money is twice as powerful as the joy of gaining it—often leads investors to make the wrong move at the worst possible time.
Why Investors Panic at the Bottom
When the market is down 10%, it feels like a bargain. When it is down 20%, it feels like a crisis. When it hits 30%, it feels like the end of the financial system as we know it. This is the point of “capitulation.” Capitulation occurs when the last of the “bulls” give up and sell their positions just to stop the emotional pain. Ironically, historical data suggests that extreme retail investor panic is often a contrarian indicator that the market is nearing a bottom.
Avoiding the “Catching a Falling Knife” Trap
While it is tempting to buy the moment the market drops, there is a risk of “catching a falling knife”—buying into a decline that still has a long way to go. Investors often ask, “How far down can it go?” The answer is that markets can stay irrational longer than you can stay solvent. Trying to time the exact bottom is a loser’s game. Instead of looking for the absolute low point, successful investors look for “value zones” where prices become attractive relative to long-term earnings potential.
Strategic Responses to a Declining Market
If you find that the market is down significantly, your response should be dictated by your time horizon and your liquidity needs. A 25-year-old with a 40-year horizon should view a down market very differently than a 64-year-old planning to retire next year.
Dollar-Cost Averaging During Volatility
One of the most effective ways to handle a market that keeps going down is Dollar-Cost Averaging (DCA). By investing a fixed amount of money at regular intervals, you automatically buy more shares when prices are low and fewer shares when prices are high. If the market is down 20%, your monthly contribution is simply buying 20% more “units” of the economy than it was a few months prior. This removes the need to guess “how far down” the market will go.
Rebalancing and Tax-Loss Harvesting
A down market provides unique tactical opportunities:
-
Rebalancing: If your target allocation was 60% stocks and 40% bonds, a market crash might leave you with 50% stocks. Rebalancing forces you to sell the “expensive” bonds and buy the “cheap” stocks, adhering to the golden rule of investing: buy low, sell high.
-
Tax-Loss Harvesting: In taxable accounts, you can sell positions that are “down” to realize a capital loss, which can be used to offset capital gains or up to $3,000 of ordinary income. You can then immediately buy a similar (but not substantially identical) asset to maintain your market exposure.
Indicators to Watch for a Potential Bottom
While no one has a crystal ball, certain indicators help determine if the market has fallen “far enough” to find support.
Valuation Metrics and Yield Curves
Investors look at the Forward Price-to-Earnings (P/E) ratio to see if stocks are cheap. If the S&P 500 usually trades at 18x earnings but is currently at 14x, the market is “down” in a way that suggests a margin of safety. Additionally, the Treasury yield curve—specifically the gap between 2-year and 10-year notes—is a closely watched signal. An inverted yield curve often precedes a recession, suggesting that the market may have further to fall before a true recovery begins.

Sentiment Indicators and the VIX
The CBOE Volatility Index (VIX), often called the “Fear Gauge,” measures market expectations for near-term volatility. High VIX readings (typically above 30 or 40) indicate extreme fear. Historically, when the VIX spikes to extreme highs, it often coincides with the “maximum pain” point of a market drop, suggesting that most of the selling pressure has been exhausted.
In conclusion, “how far down” the market is should be viewed as a measure of opportunity rather than a cause for alarm. For the long-term investor, every major drop in the history of the U.S. stock market has eventually been followed by a new all-time high. The key is not to predict the bottom, but to ensure that your portfolio is structured to survive the journey there and thrive during the inevitable recovery.
aViewFromTheCave is a participant in the Amazon Services LLC Associates Program, an affiliate advertising program designed to provide a means for sites to earn advertising fees by advertising and linking to Amazon.com. Amazon, the Amazon logo, AmazonSupply, and the AmazonSupply logo are trademarks of Amazon.com, Inc. or its affiliates. As an Amazon Associate we earn affiliate commissions from qualifying purchases.