
Seeing a sea of red across your brokerage dashboard can be an unsettling experience. Whether you are a seasoned investor or a newcomer building a retirement fund, the sight of major indices like the S&P 500, the Nasdaq, and the Dow Jones Industrial Average all tumbling simultaneously triggers an immediate question: Why?
Market downturns are rarely the result of a single isolated event. Instead, they are typically the product of a complex interplay between macroeconomic data, central bank policy, corporate performance, and investor psychology. Understanding the mechanics behind a market-wide sell-off is essential for maintaining a long-term perspective and avoiding the pitfalls of emotional trading.
The Macroeconomic Engine: Interest Rates and Inflation
The most frequent catalyst for a broad market decline is a shift in the macroeconomic environment, specifically regarding the “cost of money.” In the world of finance, interest rates act like gravity on stock prices. When rates rise, or when the market expects them to stay high for longer than previously anticipated, stock valuations generally feel the downward pressure.
The Role of the Federal Reserve
The Federal Reserve, and other central banks globally, have a dual mandate: to promote maximum employment and to keep prices stable. When inflation runs hot, the Fed raises the federal funds rate to cool the economy. This makes borrowing more expensive for both consumers and corporations.
When you see all stocks down today, it is often because new economic data—such as the Consumer Price Index (CPI)—suggests that inflation is stickier than expected. Investors then recalibrate their expectations, assuming the Fed will keep interest rates elevated. High rates discount the value of future cash flows, making stocks—especially high-growth tech stocks—less valuable in the present day.
Treasury Yields and the Equity Risk Premium
Stock prices do not exist in a vacuum; they compete with bonds for investor capital. When the yield on the 10-year U.S. Treasury note rises, it offers a “risk-free” alternative to the volatility of the stock market. If an investor can get a guaranteed 4.5% or 5% return from the government, they are less likely to pay a premium for risky stocks. This shift in the “equity risk premium” often leads to a mass migration of capital out of equities and into fixed income, causing a synchronized drop across sectors.
Corporate Earnings and Growth Projections
While the macro picture sets the stage, individual corporate health provides the script. However, the stock market is a forward-looking mechanism. It does not trade on how a company performed last year; it trades on what the company will do in the next six to eighteen months.
The “Whisper Number” and Guidance Misses
We often see stocks fall even after a company reports record profits. This happens because of “guidance.” If a titan of industry—think of the “Magnificent Seven” or major industrial conglomerates—signals that consumer demand is slowing or that input costs are rising, the market reacts preemptively. Because many of these large-cap stocks carry significant weight in major indices, a downward revision in their future outlook can pull the entire market lower.
Sector Contagion and the Domino Effect
The stock market is highly interconnected. If a major bank reports a high rate of credit card defaults, it doesn’t just affect the banking sector. It signals to investors that the general consumer is struggling. This leads to a sell-off in retail, travel, and discretionary spending stocks. This “contagion” effect ensures that bad news in one corner of the market quickly spreads to the rest, creating the appearance that “everything” is down.
Geopolitical Shifts and Systemic Risk
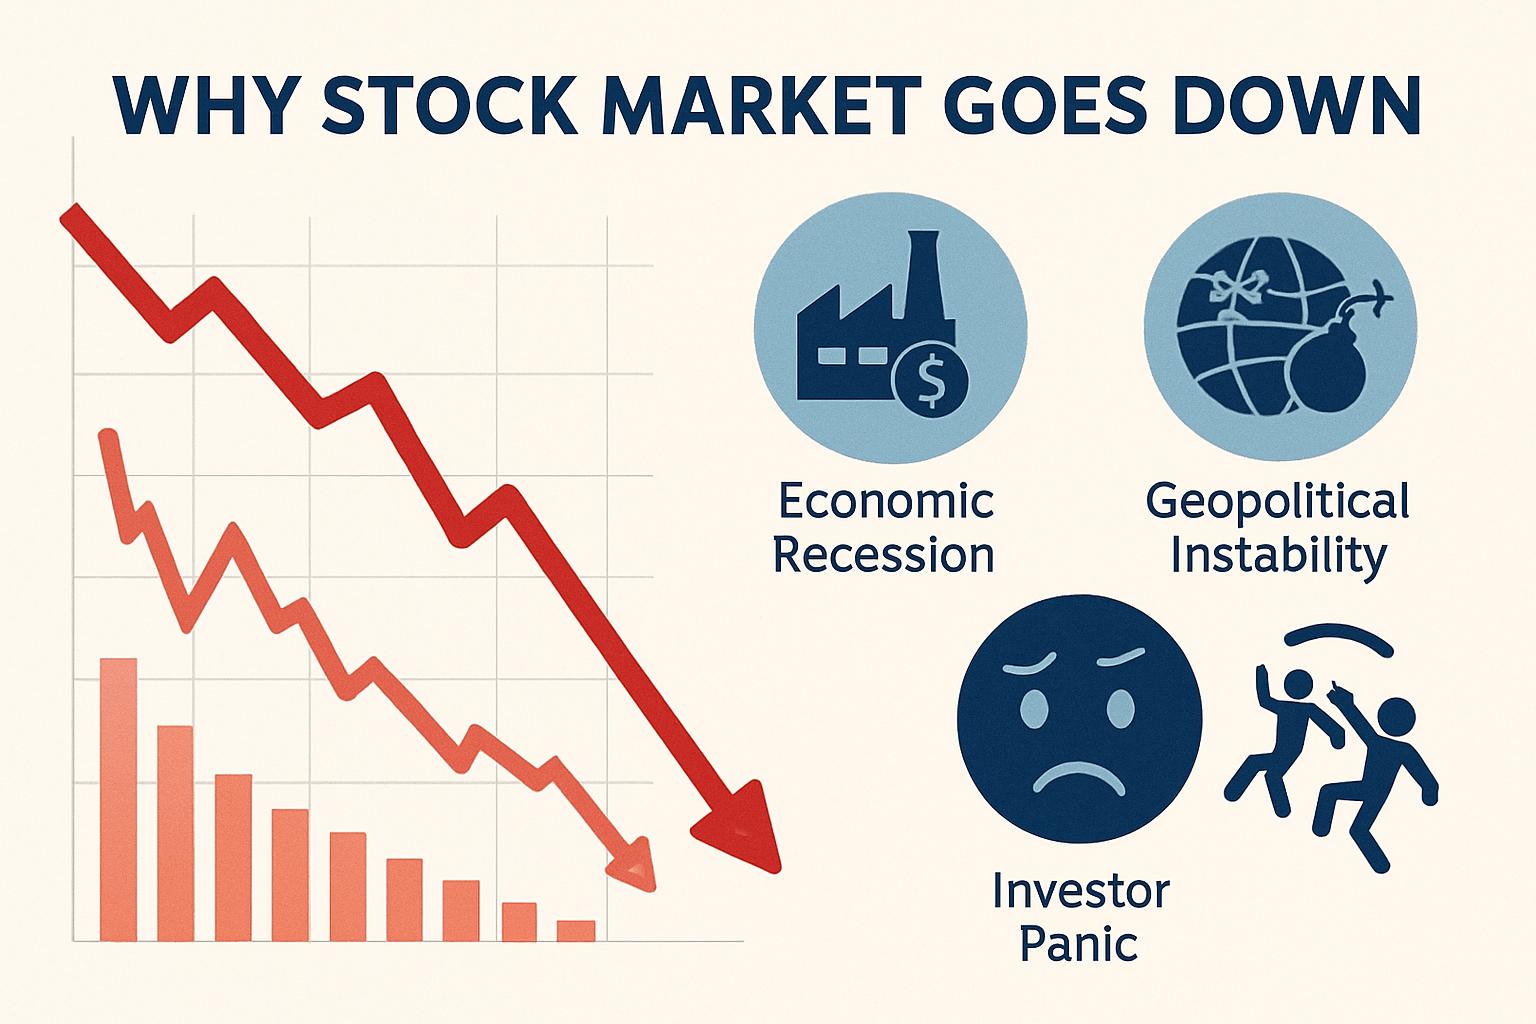
Markets loathe uncertainty. While investors can price in high interest rates or lower earnings, they struggle to price in unpredictable global events. Geopolitical instability acts as a major headwind for global trade and investor sentiment.
Energy Costs and Supply Chain Disruptions
Conflict in oil-producing regions or disruptions in key shipping lanes can cause immediate spikes in energy prices. Since energy is a primary input for almost every business—from manufacturing to delivery services—higher oil prices act as a “tax” on corporate profits. When the market perceives a threat to the global supply chain, it broadens its risk assessment, leading to a defensive posture where investors sell off equities in favor of “safe haven” assets like gold or the U.S. Dollar.
Currency Fluctuations
For multi-national corporations, the strength of the U.S. Dollar is a critical factor. If the dollar strengthens significantly against the Euro or the Yen, the international earnings of U.S. companies are worth less when converted back into dollars. On days when the dollar spikes due to global instability, it puts a mathematical ceiling on the earnings potential of the S&P 500, often resulting in a red day for the indices.
The Mechanics of the Sell-Off: Psychology and Algorithms
Beyond the fundamental reasons of economy and earnings, the “how” of a market crash often involves the technical structure of modern trading. The speed at which markets decline today is much faster than in decades past, primarily due to automation and the psychological feedback loops of the digital age.
Algorithmic Trading and Stop-Loss Triggers
A significant portion of daily trading volume is executed by high-frequency trading (HFT) algorithms. These programs are designed to react to specific data points or price levels in milliseconds. If a major index breaks below a “technical support level” (a price point where buyers historically step in), it can trigger a cascade of automated sell orders. This creates a “snowball effect” where the initial decline triggers more selling, regardless of the underlying value of the companies involved.
Margin Calls and Forced Liquidation
Many institutional and individual investors trade on “margin,” meaning they borrow money from their brokers to buy more shares. When stock prices fall to a certain level, brokers issue margin calls, requiring the investor to deposit more cash or sell their positions. This forced liquidation adds further downward pressure on prices. In a sharp downturn, investors are often forced to sell their “winners” (the good stocks) to cover the losses on their “losers,” leading to a situation where even high-quality companies see their share prices tank.
The Fear and Greed Index
Human psychology remains the ultimate driver of market cycles. The “Fear and Greed Index” often moves into “Extreme Fear” during broad market sell-offs. When investors see the market dropping, the primal instinct to protect capital takes over. This leads to “panic selling,” where the goal is no longer to make a profit, but to stop the bleeding. When enough participants decide to “exit at any price,” the market experiences a liquidity vacuum where there are many sellers but few buyers, causing prices to gape lower.
How to Navigate a Broad Market Decline
Understanding why the market is down is the first step toward becoming a more resilient investor. While the immediate reaction might be to sell and “wait for things to settle down,” history suggests that the most successful investors are those who can remain rational when the crowd is panicking.
Reassessing Your Investment Thesis
When the market is down, it is a perfect time to review why you bought your stocks in the first place. If the reason for the decline is a temporary macroeconomic shift (like a one-time interest rate hike) rather than a fundamental flaw in the companies you own, your investment thesis likely remains intact. Volatility is the price of admission for the long-term returns the stock market provides.
The Power of Dollar-Cost Averaging
For those in the wealth-accumulation phase of their lives, a down market is actually a gift. Through dollar-cost averaging—investing a fixed amount of money at regular intervals—you naturally buy more shares when prices are low and fewer shares when prices are high. Over time, this lowers your average cost basis and positions you for significant gains when the market inevitably recovers.
Portfolio Rebalancing and Tax-Loss Harvesting
A “red day” provides a strategic opportunity to rebalance your portfolio. If your stock allocation has shrunk and your bond allocation has grown due to the sell-off, you can sell some bonds to buy stocks at a discount, bringing your portfolio back to its target risk level.
Additionally, investors can utilize “tax-loss harvesting.” This involves selling a security that is at a loss to offset capital gains taxes in other parts of your portfolio. By realizing a loss during a market dip, you can improve your after-tax returns, essentially turning a market decline into a strategic fiscal advantage.
Maintaining a Long-Term Perspective
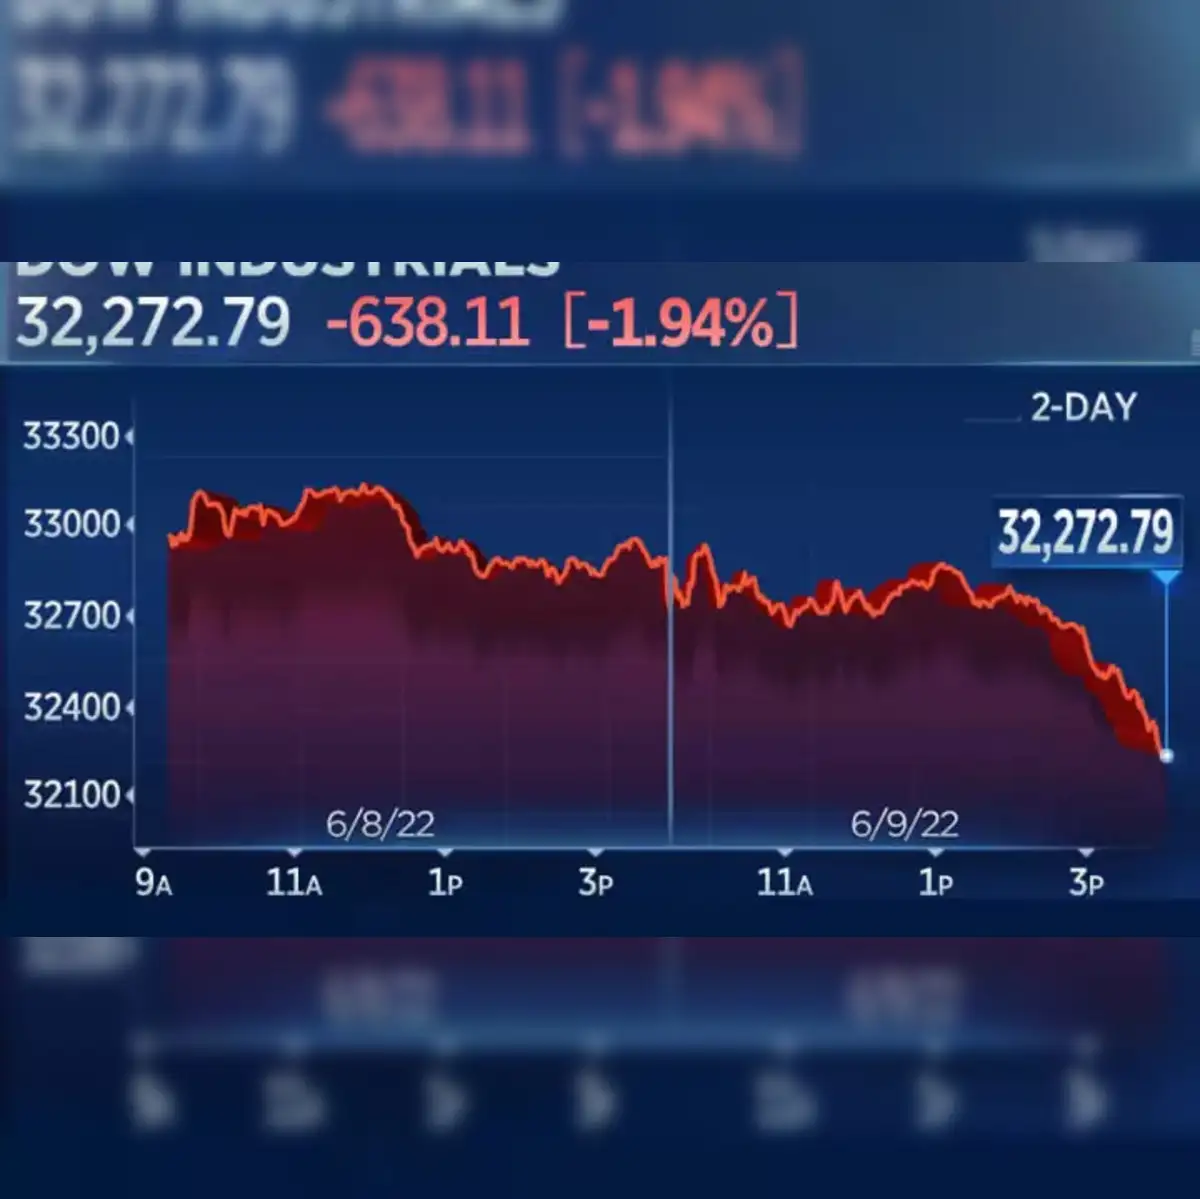
The stock market has a 100% track record of recovering from every single downturn, recession, and crash in its history. While today’s decline feels urgent and painful, it is usually just a small blip in a multi-decade chart. Successful investing in the “Money” niche isn’t about timing the market to avoid every red day; it’s about “time in the market” and having the discipline to stay invested when everyone else is looking for the exit.
In summary, when all the stocks are down today, it is rarely a sign of the end of the financial system. Instead, it is usually the market “digesting” new information, adjusting to higher costs of capital, or reacting to geopolitical noise. By understanding these levers, you can transition from an emotional observer to a strategic participant in the global economy.
aViewFromTheCave is a participant in the Amazon Services LLC Associates Program, an affiliate advertising program designed to provide a means for sites to earn advertising fees by advertising and linking to Amazon.com. Amazon, the Amazon logo, AmazonSupply, and the AmazonSupply logo are trademarks of Amazon.com, Inc. or its affiliates. As an Amazon Associate we earn affiliate commissions from qualifying purchases.