
The S&P 500 is widely regarded as the most accurate barometer of the United States stock market and, by extension, the health of the global economy. For investors, financial analysts, and personal finance enthusiasts, the index serves as the ultimate benchmark against which all other investments are measured. However, the history of the S&P 500 is not a single point in time, but rather an evolution that mirrors the industrial and technological progression of the American financial system. To understand when the S&P 500 started, one must look back nearly a century to the early days of statistical tracking, through the pivotal expansion of 1957, and into the high-frequency trading era of today.

The Evolution of the Index: From 90 to 500 Companies
The S&P 500 as we know it today—a market-capitalization-weighted index of 500 of the largest publicly traded companies in the U.S.—officially launched on March 4, 1957. However, the roots of the index stretch back much further, originating in a time when tracking the stock market was a manual, laborious task involving pen, paper, and physical ticker tapes.
The 1923 Origins and the Standard Statistics Company
In 1923, the Standard Statistics Company developed the first incarnation of what would become the S&P index. At its inception, it was not the massive list of 500 companies we see today; instead, it was a weekly index that tracked just 233 companies across 26 different industries. The goal was simple yet revolutionary: to provide a broad view of the stock market’s performance rather than focusing on just a handful of industrial giants, which was the primary limitation of the Dow Jones Industrial Average at the time.
By 1926, Standard Statistics introduced a daily index that tracked 90 stocks. This “S&P 90” became the industry standard for three decades, offering a more granular and frequent look at market movements. This period was critical because it established the “market-weighting” methodology—calculating the index based on the total market value of the companies rather than just their share price—which remains a cornerstone of the S&P 500’s philosophy.
The 1941 Merger and the 1957 Expansion
A major turning point occurred in 1941 when the Standard Statistics Company merged with Poor’s Publishing, a provider of investor manuals and financial information founded by Henry Varnum Poor. This merger created Standard & Poor’s (S&P). Following the merger, the company continued to refine its data collection and analysis techniques.
The most significant milestone in the history of the index occurred on March 4, 1957. Facilitated by the advent of more sophisticated computing technology, Standard & Poor’s expanded its index from 90 to 500 companies. This transition was monumental because it allowed the index to cover approximately 80% of the available market capitalization of the U.S. equity markets. It was at this moment that the “S&P 500” was born, providing the comprehensive diversification that modern investors rely on to gauge the overall performance of the corporate sector.
Why the Start Date Matters for Long-Term Investors
Understanding the timeline of the S&P 500 is not merely an exercise in financial trivia; it is essential for contextualizing historical returns and setting realistic expectations for personal wealth growth. The decades of data accumulated since 1957 provide the backbone for modern portfolio theory and passive investing strategies.
Historical Returns and the Power of Compound Interest
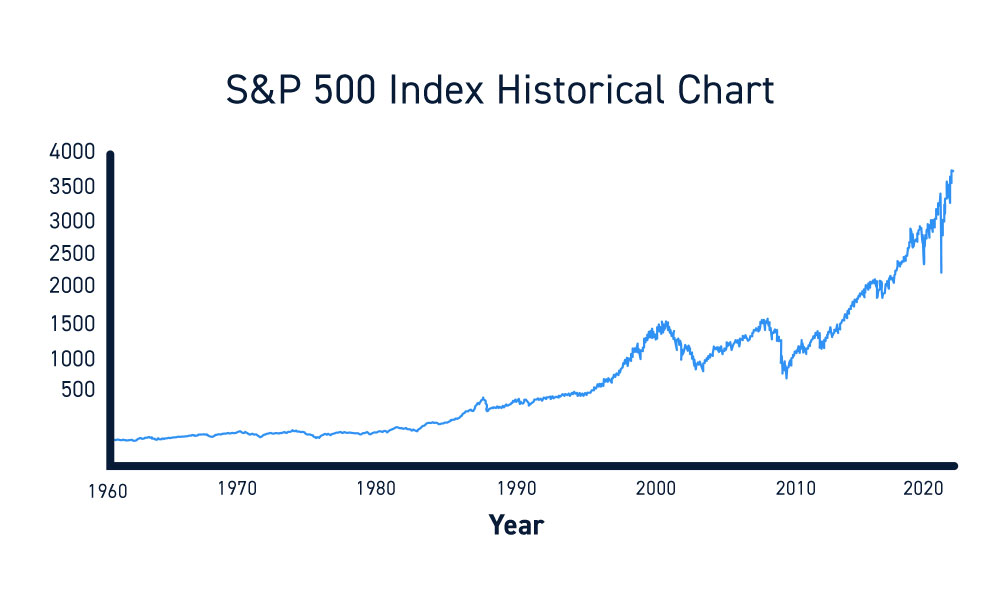
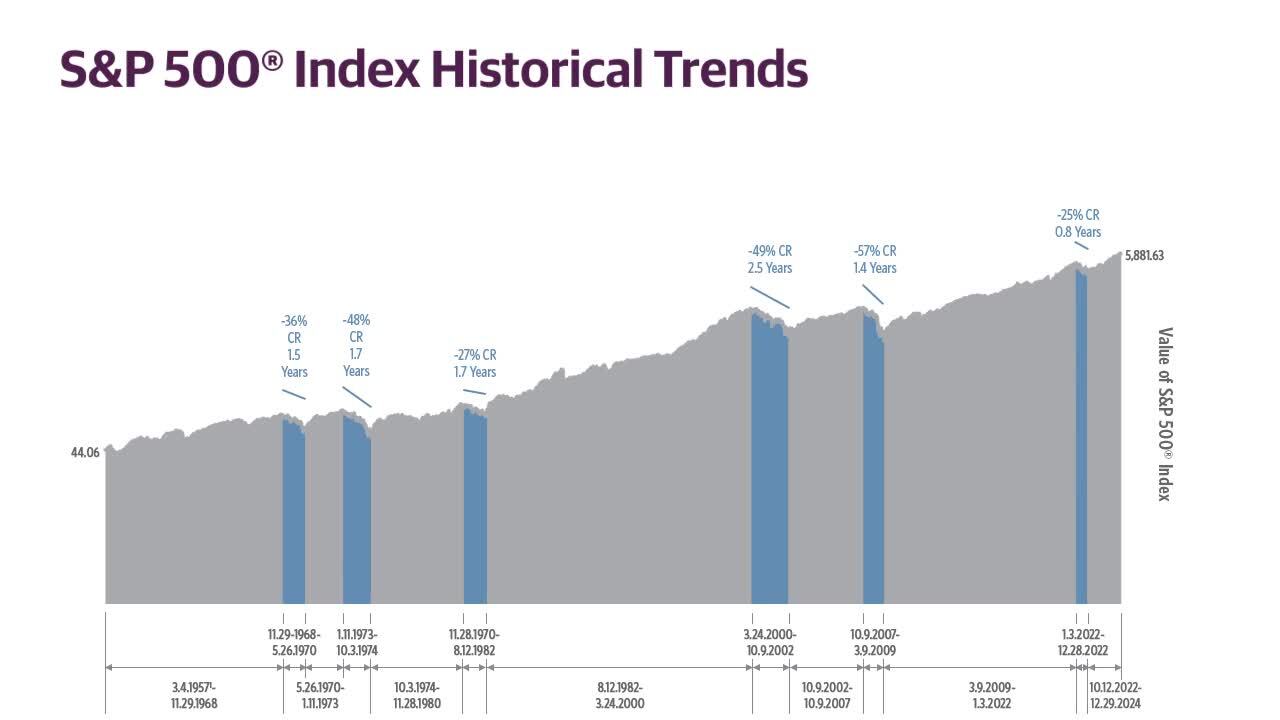
The long-term history of the S&P 500 serves as the primary evidence for the “buy and hold” investment strategy. Since its expansion in 1957, the index has delivered an average annual return of approximately 10% before adjusting for inflation. While this does not mean the market returns 10% every single year, the data over seven decades shows that the market has a consistent upward trajectory despite short-term setbacks.
For personal finance enthusiasts, this historical data is the foundation of the “Rule of 72” and other compounding calculations. By looking at the start date and the subsequent performance, investors can see that despite the Great Recession of 2008, the Dot-com bubble of 2000, and the stagflation of the 1970s, the index has historically recovered and reached new highs. This long-term perspective is what gives investors the confidence to stay invested during periods of high volatility.
Market Volatility Through the Decades
The longevity of the S&P 500 allows for a deep analysis of market cycles. By studying the index from its 1957 inception, financial planners can identify patterns in “bull” and “bear” markets. The start date provides a baseline to measure the severity and duration of economic downturns. For instance, the S&P 500 data reveals that while bear markets (declines of 20% or more) are emotionally taxing, they are historically shorter in duration than bull markets. This historical context is vital for building a resilient mindset, helping investors avoid panic selling and stick to their long-term financial goals.
Methodology: How the S&P 500 is Calculated and Maintained
The S&P 500 is more than just a list of the 500 largest companies; it is a “float-adjusted” market-capitalization-weighted index. The way the index has been calculated since its start has evolved to ensure it remains a relevant representation of the changing American economy.
Market Capitalization Weighting
Unlike the Dow Jones Industrial Average, which is price-weighted (where a higher stock price gives a company more influence regardless of its size), the S&P 500 uses market capitalization. To calculate a company’s weight in the index, you take its share price and multiply it by the number of shares outstanding. This means that a trillion-dollar company like Apple or Microsoft has a significantly larger impact on the index’s movement than a company with a $20 billion valuation.
This methodology, which was refined during the 1957 launch, ensures that the index reflects the actual economic impact of each company. As a company grows and its market value increases, its influence on the S&P 500 grows proportionally. This self-cleansing nature—where winners grow and losers shrink or are removed—is why the index has been such a successful wealth-building tool over time.
Inclusion Criteria and the Index Committee
A common misconception is that the S&P 500 is an automated list of the top 500 companies. In reality, the index is maintained by the S&P Index Committee, which follows a strict set of eligibility criteria. For a company to be added to the index today, it must meet specific requirements:
-
Market Cap: It must have a high unadjusted market capitalization (currently in the billions).
-
Liquidity: The stock must be highly liquid, meaning it is easy to buy and sell in large volumes.
-
Profitability: The company must have positive earnings over the most recent quarter and the sum of the previous four quarters.
-
Public Float: At least 50% of its shares must be available to the public.
These criteria ensure that the S&P 500 remains a “quality” index. By requiring profitability, the committee protects the index from speculative bubbles that might include massive but unprofitable companies. This rigorous selection process is a major reason why the S&P 500 is often preferred over total market indices by institutional investors.
The S&P 500 as a Modern Benchmark for Wealth
Since its start, the S&P 500 has transitioned from a data point for professionals to a direct investment vehicle for the masses. This transition has completely reshaped how individuals manage their personal finances and plan for retirement.
The Rise of Passive Investing
Before the 1970s, the S&P 500 was mostly a reference point. If you wanted to invest in the market, you had to pick individual stocks or pay high fees for an actively managed mutual fund. This changed in 1976 when John Bogle, the founder of Vanguard, launched the first index fund for individual investors, which sought to track the S&P 500.
This was a revolutionary moment in financial history. It allowed everyday people to own a tiny piece of the 500 most successful companies in America for a very low cost. Today, index funds and Exchange-Traded Funds (ETFs) that track the S&P 500, such as SPY or VOO, are the cornerstones of millions of 401(k)s and IRAs. The start of the index provided the data; the rise of the index fund provided the access.
Global Economic Influence and Sector Shifts
The composition of the S&P 500 has changed dramatically since 1957, reflecting the shift in the American economy. In the late 50s and 60s, the index was dominated by industrial, manufacturing, and railroad companies. Today, the index is heavily weighted toward Information Technology and Health Care.
Watching the evolution of these sectors within the S&P 500 provides a roadmap of where the world’s money is moving. For an investor, the S&P 500 is not just a historical record but a dynamic entity that automatically rebalances to include the leaders of the new economy—whether that be the rise of the internet in the 90s or the explosion of Artificial Intelligence in the 2020s. By investing in the index, a person is essentially betting on the continued innovation and growth of the corporate world without having to guess which specific company will lead the way.
Ultimately, the start of the S&P 500 in 1957 marked the beginning of a new era of transparency and systematic growth in the financial world. It provided the framework for the modern benchmark that guides everything from pension fund allocations to the “FIRE” (Financial Independence, Retire Early) movement. Understanding its history allows investors to appreciate the index not just as a number on a screen, but as a robust, time-tested engine of global capitalism.
aViewFromTheCave is a participant in the Amazon Services LLC Associates Program, an affiliate advertising program designed to provide a means for sites to earn advertising fees by advertising and linking to Amazon.com. Amazon, the Amazon logo, AmazonSupply, and the AmazonSupply logo are trademarks of Amazon.com, Inc. or its affiliates. As an Amazon Associate we earn affiliate commissions from qualifying purchases.