
The question “What did the S&P 500 close at today?” is perhaps the most frequent query in the world of finance. For seasoned traders, institutional fund managers, and casual retail investors alike, the daily closing price of the Standard & Poor’s 500 Index is more than just a numerical value; it is a vital sign of the American economy and a barometer for global market sentiment. While the specific number fluctuates by the second during trading hours, the final bell at 4:00 PM Eastern Time establishes a definitive marker that influences financial headlines, retirement accounts, and corporate boardrooms across the globe.
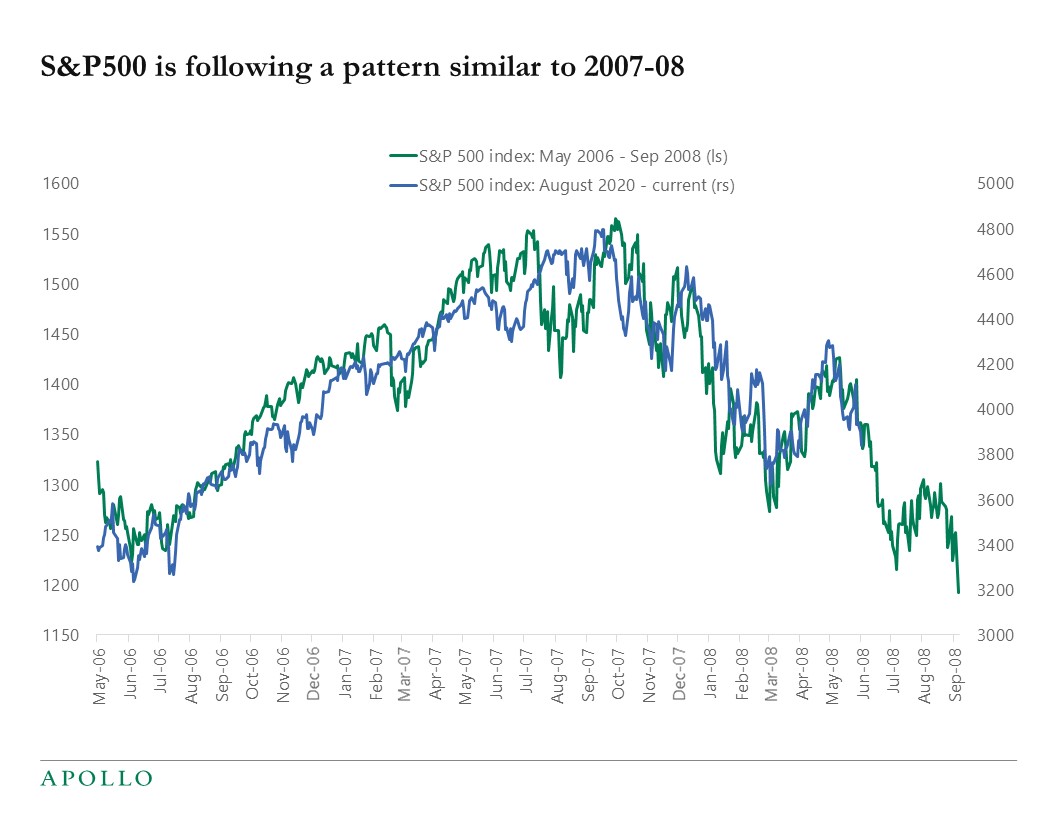
To understand the significance of the daily close, one must look beyond the immediate digit. The S&P 500 tracks the performance of 500 of the largest companies listed on stock exchanges in the United States. Because it covers approximately 80% of available market capitalization, it is widely regarded as the best single gauge of large-cap U.S. equities. When the index closes “up,” it suggests a day of optimism, growth, or recovery; when it closes “down,” it often reflects concerns over inflation, interest rates, or geopolitical instability.
Deciphering the S&P 500: More Than Just a Number
The closing price of the S&P 500 is the weighted average of its constituent parts. Unlike the Dow Jones Industrial Average, which is price-weighted, the S&P 500 is market-capitalization-weighted. This means that companies with higher market valuations—such as the tech giants in the “Magnificent Seven”—have a more profound impact on the index’s daily movement than smaller members.
What the Index Represents
The S&P 500 serves as a proxy for the health of the U.S. corporate sector. It is comprised of eleven different sectors, including Information Technology, Health Care, Financials, Consumer Discretionary, and Energy. When you ask what the index closed at, you are essentially asking for a consolidated report card on these diverse industries. A rise in the index might be driven by a rally in technology stocks, even if the energy sector is lagging, illustrating the importance of internal market breadth.
The Market Capitalization Weighting System
Because the index is float-adjusted market-cap weighted, it reflects the actual investable opportunity in the market. When a massive entity like Apple or Microsoft sees a 2% price movement, it shifts the entire S&P 500 closing price significantly more than a 2% move from a smaller company like a regional utility provider. This structure ensures that the index remains relevant to where the majority of investor capital is actually deployed, though it also means the “close” can sometimes be skewed by a handful of high-performing mega-cap stocks.
The Significance of the “Closing Bell”
The closing price is determined by a “closing auction” on the exchanges, a process designed to find the most efficient price to settle all remaining orders for the day. This price is used by mutual funds to calculate their Net Asset Value (NAV) and by derivatives traders to settle contracts. For the average investor, the close represents the final consensus of value for the day, stripped of the intraday noise and volatility that can characterize the morning and afternoon sessions.
Factors Influencing the Daily Closing Price
The number you see at the end of the day is the result of millions of transactions driven by a complex web of fundamental and technical factors. No single event dictates the close; rather, it is a tug-of-war between buyers and sellers reacting to the latest information.
Economic Indicators and Interest Rates
One of the most potent drivers of the S&P 500’s daily performance is macroeconomic data. Reports on the Consumer Price Index (CPI), employment numbers (Non-Farm Payrolls), and Gross Domestic Product (GDP) growth can cause the index to swing wildly. Central bank policy, specifically the decisions made by the Federal Reserve regarding interest rates, plays a foundational role. Higher interest rates typically increase borrowing costs for companies and discount the value of future earnings, often leading to a lower index close. Conversely, signals of “dovish” policy or rate cuts frequently trigger a buying spree that pushes the closing price higher.
Corporate Earnings Reports
Four times a year, during “earnings season,” the S&P 500 becomes particularly sensitive to the financial health of its individual members. If heavyweights in the tech or banking sectors report profits that exceed analyst expectations, the index often climbs. However, the closing price is not just about current profits; it is about “guidance.” If a major company reports record earnings but warns of a slowdown in the coming months, its stock—and the index—may close lower as investors price in future risks.
Global Geopolitical Events
The S&P 500 does not exist in a vacuum. Trade wars, military conflicts, international elections, and changes in foreign energy policy can all impact the U.S. market. For instance, a sudden spike in global oil prices can weigh heavily on airlines and retailers within the S&P 500 while boosting energy stocks. The daily close reflects how the market has synthesized these global risks into a single North American perspective.

Why the Closing Price Matters to Everyday Investors
For someone saving for retirement or managing a personal brokerage account, the daily movement of the S&P 500 might seem like academic trivia. However, these daily numbers compound into the long-term trends that determine financial security.
Benchmarking Your Portfolio
Most diversified investment portfolios are measured against the S&P 500. If the index closed up 1.5% today and your personal portfolio only rose by 0.5%, it may indicate that your asset allocation is more conservative or that your specific holdings are underperforming the broader market. This “alpha” (the ability to beat the index) and “beta” (the correlation with the index) are fundamental concepts in personal finance. Knowing the daily close helps you understand if you are keeping pace with the “average” market return.
The Psychology of Market Sentiment
The closing price often sets the tone for the following day’s opening. A “strong close,” where the index finishes near its daily high, suggests that buying pressure remains and may carry over into the next session. A “weak close,” where the index gives up gains in the final hour, can signal exhaustion among buyers. For emotional investors, these daily closes can trigger “FOMO” (Fear Of Missing Out) during bull markets or panic selling during bear markets. Professional financial planning emphasizes looking past these daily emotional triggers.
Technical Analysis and Support Levels
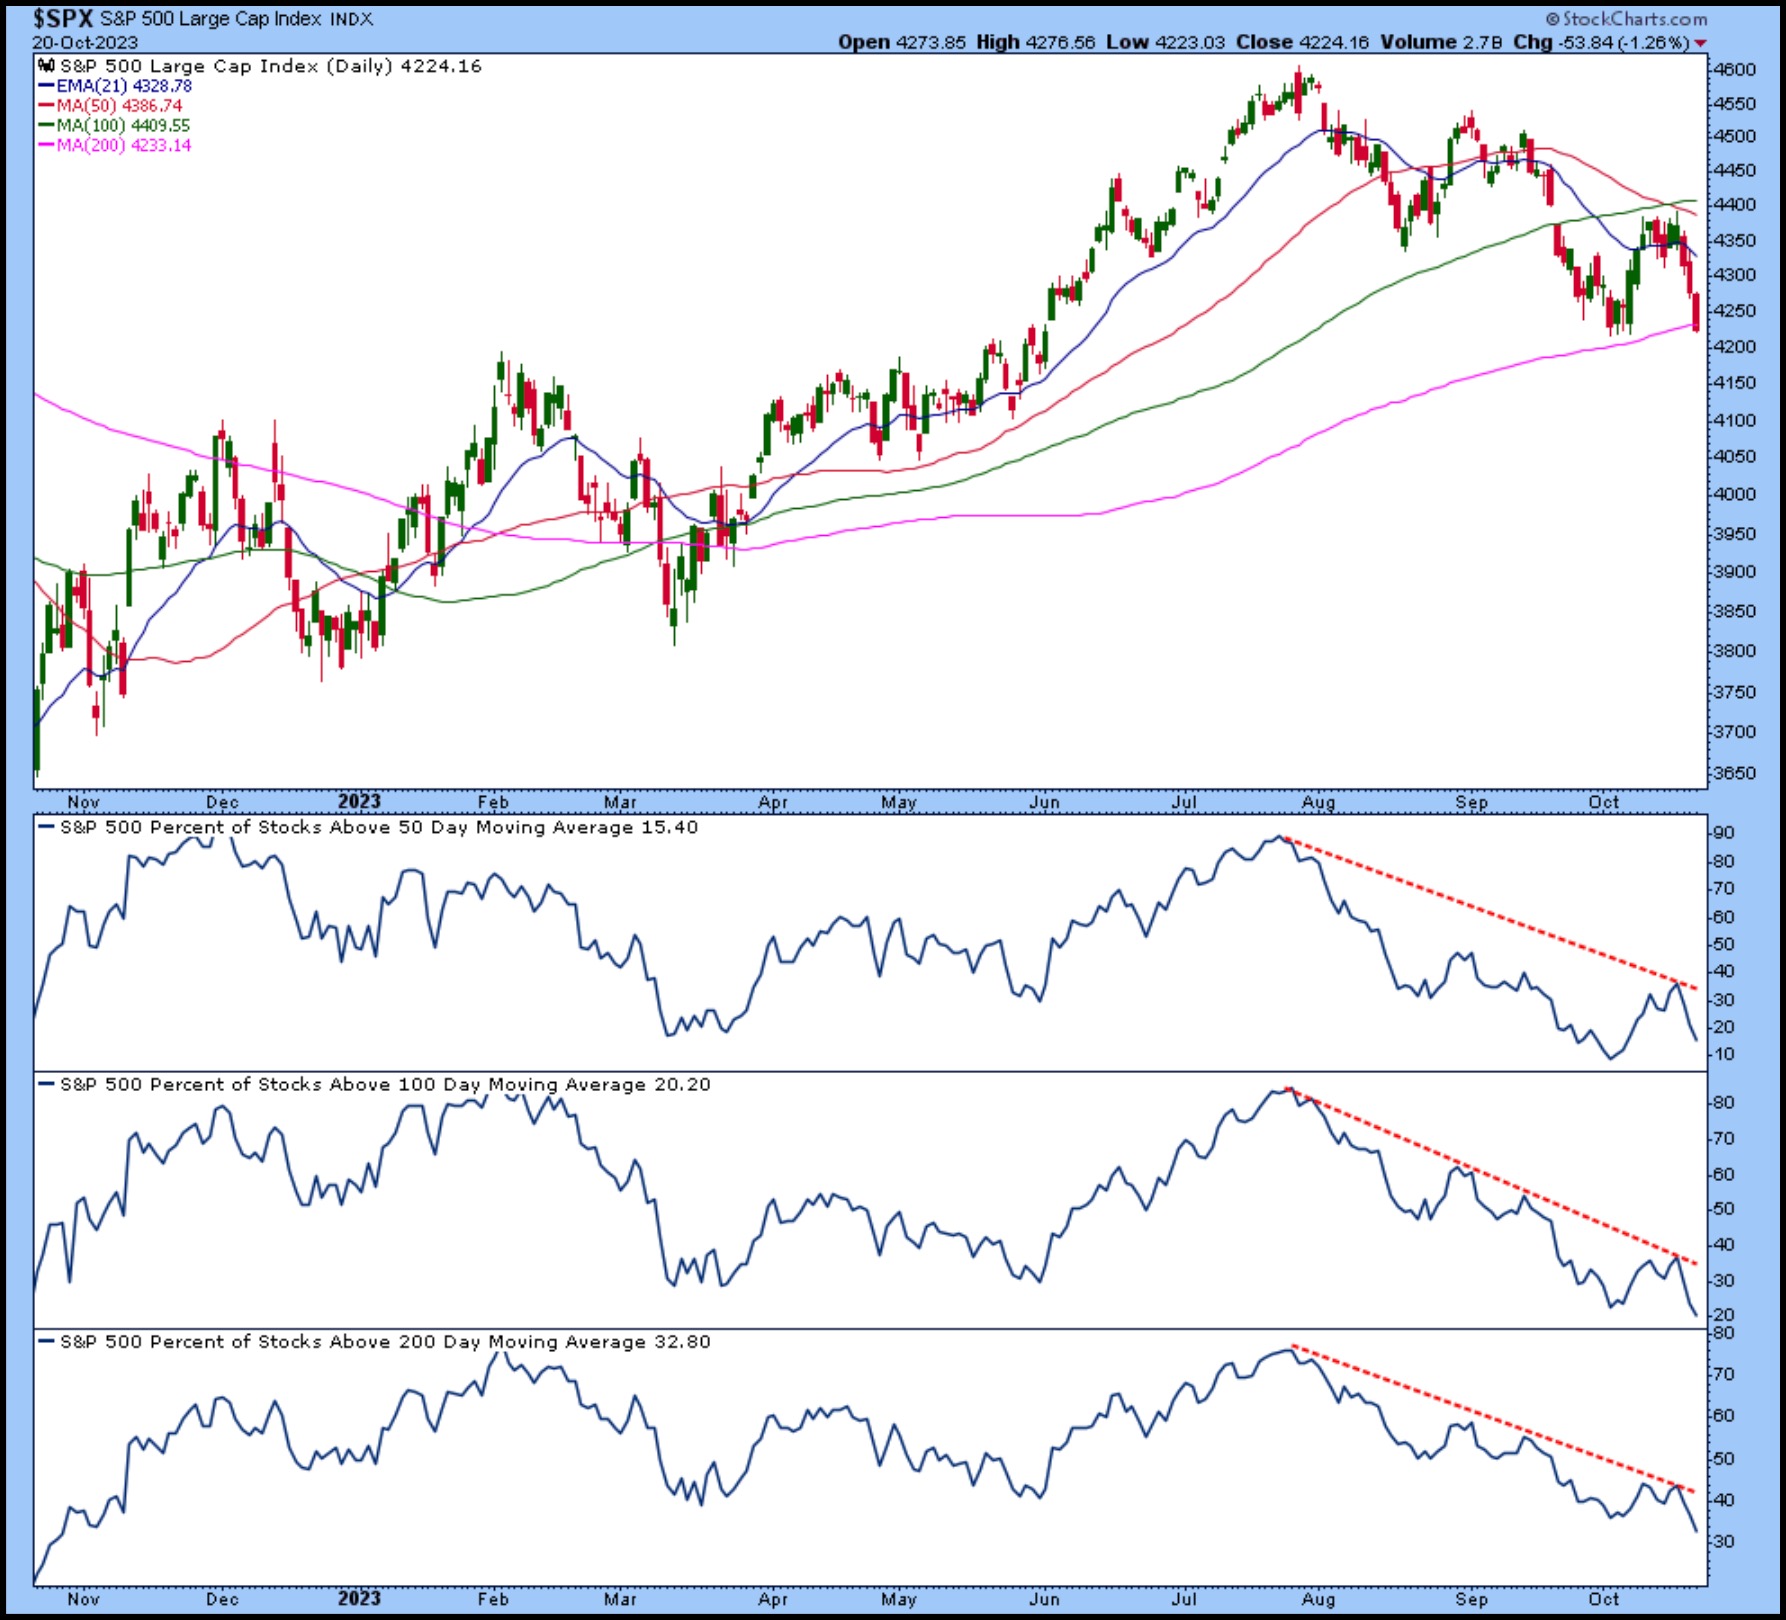
Market technicians look at the closing price to identify “support” and “resistance” levels. For example, if the S&P 500 has struggled to close above a certain round number, such as 5,000, that level becomes a psychological and technical barrier. Breaking through and closing above such a level can often lead to accelerated gains as systematic trading algorithms and institutional investors interpret the close as a signal of a new upward trend.
Strategies for Investing in the S&P 500
Knowing what the S&P 500 closed at today is one thing; knowing how to capitalize on its long-term trajectory is another. Because the index is so difficult for individual stock-pickers to beat consistently, many investors choose to “buy the market” itself.
Index Funds and ETFs
The rise of passive investing has made the S&P 500 accessible to everyone. Exchange-Traded Funds (ETFs) like SPY, IVV, and VOO allow investors to buy a tiny piece of all 500 companies in the index with a single transaction. These funds track the index almost perfectly, meaning your investment will close every day at a value that mirrors the S&P 500’s performance, minus a very small management fee.
Dollar-Cost Averaging
For those concerned about whether the S&P 500 closed “too high” today, dollar-cost averaging (DCA) is a popular strategy. By investing a fixed amount of money at regular intervals (e.g., once a month), you buy more shares when the index closes lower and fewer shares when it closes higher. Over time, this reduces the impact of daily volatility and eliminates the stress of trying to “time the market” based on a single day’s closing price.
Long-Term vs. Short-Term Perspectives
While the daily close is important for news cycles, the historical performance of the S&P 500 suggests that the “long close”—the price years from now—is what truly matters. Historically, the index has provided an average annual return of roughly 7% to 10% when dividends are reinvested. Investors who focus too much on whether the index closed down a half-percent today risk losing sight of the power of compounding interest over decades.
Beyond the Daily Close: Building a Resilient Financial Future
In the digital age, we are bombarded with notifications about market movements. A “breaking news” alert that the S&P 500 closed at a record high or suffered its worst day in months can induce an immediate visceral reaction. However, the most successful investors treat the daily closing price as data, not as a directive for immediate action.
The daily close is a snapshot in time—a collective agreement of value reached by millions of participants. While it tells us what happened today, it rarely tells us with certainty what will happen tomorrow. A resilient financial strategy involves understanding the components of the S&P 500, recognizing the macroeconomic forces that move it, and maintaining a disciplined approach to investing that transcends the daily fluctuations of the ticker tape.
Whether the S&P 500 closed at a new peak or in the depths of a correction today, the fundamental engine of the index remains the same: the innovation, productivity, and earnings power of the largest companies in the world. By keeping the daily close in its proper perspective, investors can navigate the complexities of the financial markets with a sense of professional insight and long-term confidence.
aViewFromTheCave is a participant in the Amazon Services LLC Associates Program, an affiliate advertising program designed to provide a means for sites to earn advertising fees by advertising and linking to Amazon.com. Amazon, the Amazon logo, AmazonSupply, and the AmazonSupply logo are trademarks of Amazon.com, Inc. or its affiliates. As an Amazon Associate we earn affiliate commissions from qualifying purchases.