
Understanding how the stock market is performing on any given day requires more than a simple glance at a ticker or a flashing green or red number on a smartphone screen. For the modern investor, “how the stock market is doing today” is a multifaceted question that encompasses global economic shifts, corporate earnings reports, geopolitical stability, and the nuanced psychology of millions of market participants. To truly grasp the state of the market, one must look beneath the surface of the major indices to identify the underlying drivers of price action and the long-term implications of short-term volatility.
Analyzing the Core Indicators of Market Performance
The pulse of the stock market is most often measured through a handful of major indices, each serving as a barometer for different segments of the economy. When investors ask how the market is doing, they are typically referring to the performance of the S&P 500, the Dow Jones Industrial Average (DJIA), and the Nasdaq Composite.
The Major Indices and Their Significance
The S&P 500 is widely considered the most accurate representation of the overall U.S. stock market. Comprising 500 of the largest publicly traded companies, it is market-capitalization-weighted, meaning that the largest companies—often in the technology and healthcare sectors—have a disproportionate impact on its movement. When the S&P 500 is up, it generally indicates broad confidence in the American corporate landscape.
In contrast, the Dow Jones Industrial Average is a price-weighted index of 30 “blue-chip” companies. While it is the oldest and most cited index in mainstream media, its narrow focus and weighting methodology make it less representative of the broader market than the S&P 500. However, it remains a vital indicator of industrial and value-oriented sentiment.
The Nasdaq Composite is heavily skewed toward the technology sector and growth-oriented companies. In the current era, where artificial intelligence and digital transformation drive significant capital allocation, the Nasdaq’s performance often dictates the “risk-on” or “risk-off” appetite of investors. A strong day for the Nasdaq frequently correlates with high investor confidence in future innovation and lower interest rate expectations.
Sector Rotation and Leadership
A green day for the indices does not necessarily mean every stock is rising. Market health is often determined by sector rotation—the movement of money from one industry to another. On days when technology stocks take a breather, defensive sectors like Consumer Staples, Utilities, or Healthcare may see inflows as investors seek safety. Conversely, during periods of economic expansion, cyclical sectors like Industrials, Financials, and Energy often lead the charge. Monitoring which sectors are leading the market provides insight into whether the current movement is a speculative rally or a fundamentally driven advance.
The Macroeconomic Drivers Shaping Today’s Markets
The daily fluctuations of the stock market are rarely isolated events; they are responses to a complex web of macroeconomic data points. Professional traders and long-term investors alike keep a close watch on several key pillars of the economy to interpret today’s price action.
Interest Rates and Federal Reserve Policy
Perhaps no single factor influences the stock market more than the monetary policy of the Federal Reserve. Interest rates are the “gravity” of the financial markets. When the Fed signals a “hawkish” stance—implying higher interest rates to combat inflation—stock prices, particularly those of growth companies, often face downward pressure. This is because higher rates increase the cost of borrowing and decrease the present value of future earnings.
On any given day, a speech from a Federal Reserve official or the release of the “minutes” from a recent policy meeting can send shockwaves through the market. Investors look for clues regarding the “terminal rate”—the peak level of interest rates—and any potential for a “pivot” toward rate cuts, which generally acts as a catalyst for market rallies.
Inflation Data and Consumer Spending
Inflation remains a central theme in determining market direction. Indicators such as the Consumer Price Index (CPI) and the Producer Price Index (PPI) are high-stakes events on the financial calendar. If inflation data comes in higher than expected, the market often reacts negatively, fearing that the Fed will keep rates higher for longer.
Furthermore, because the U.S. economy is driven largely by consumer spending, data regarding retail sales and consumer confidence is paramount. If the consumer is resilient, corporations can maintain profit margins, which supports higher stock valuations. Conversely, signs of a slowing consumer can trigger fears of a recession, leading to market sell-offs regardless of individual company performance.
Investor Psychology and Sentiment Analysis
While fundamentals and macroeconomics provide the framework, investor psychology provides the fuel for daily market movements. The stock market is, at its core, a giant weighing machine of human emotion, oscillating between fear and greed.
The Fear and Greed Index and Volatility
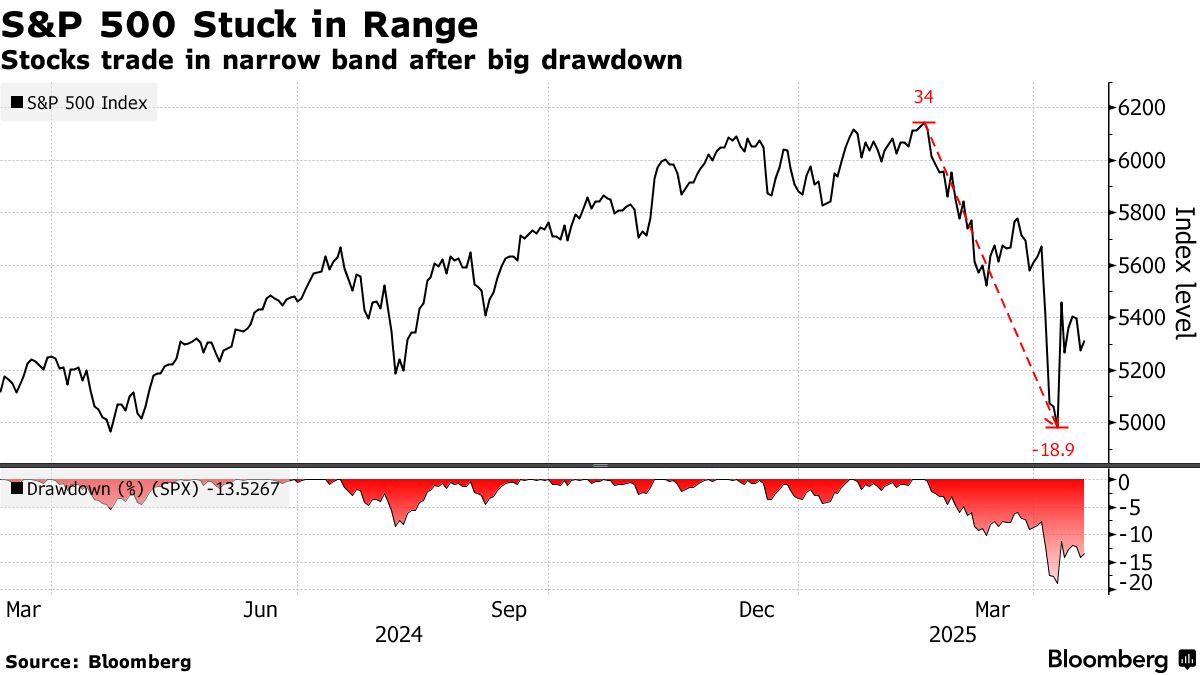
The CBOE Volatility Index, commonly known as the VIX or the “fear gauge,” measures the market’s expectation of 30-day volatility. When the VIX is high, it indicates significant uncertainty and fear among investors, often coinciding with market drops. When the VIX is low, it suggests a “complacent” market, which can sometimes precede a correction.
Sentiment indicators, such as the CNN Fear & Greed Index, aggregate various factors like junk bond demand and stock price strength to provide a snapshot of the prevailing mood. Understanding these metrics helps investors determine if “today’s” market is driven by rational valuation or emotional overreaction. For the disciplined investor, extreme fear often presents a buying opportunity, while extreme greed serves as a signal for caution.
The Impact of Earnings Season
Four times a year, the market enters “earnings season,” a period where publicly traded companies report their quarterly financial results. During these weeks, the daily performance of the market is highly sensitive to corporate guidance. Even if a company beats its revenue and profit estimates, its stock may fall if its outlook for the next quarter is cautious. The market is forward-looking; it cares less about what happened in the last three months and more about what the “C-suite” expects for the next year. Positive earnings surprises from “market bellwethers”—the largest companies in the S&P 500—can lift the entire market, creating a “halo effect” that boosts investor sentiment across the board.
Strategies for Monitoring Daily Market Movements
For those looking to stay informed without becoming overwhelmed by the constant stream of data, having a structured approach to monitoring the market is essential.
Essential Financial Tools and Real-Time Data
In the digital age, investors have access to the same high-quality data once reserved for Wall Street professionals. Real-time charting tools, financial news aggregators, and portfolio tracking apps allow for instant updates. However, the key to using these tools effectively is focus. Instead of watching every tick, savvy investors focus on “market breadth”—the number of stocks advancing versus declining. If the indices are up but the majority of stocks are down, it indicates a “thin” rally driven by only a few mega-cap names, which may not be sustainable.
Distinguishing Between Noise and Meaningful Signals
One of the greatest challenges in the modern financial landscape is the abundance of “noise.” Headlines are often designed to trigger emotional responses, and short-term price movements are frequently the result of algorithmic trading or institutional rebalancing rather than fundamental shifts.
To determine how the stock market is truly doing, one must distinguish between “idiosyncratic risk” (news affecting a single company) and “systemic risk” (news affecting the entire economy). A single company’s stock plummeting due to a bad earnings report is noise for the broader market. A sudden spike in oil prices or an unexpected geopolitical conflict is a signal that could alter the trajectory of the entire financial system.
Long-Term Implications of Short-Term Volatility
While it is natural to focus on how the market is doing today, the most successful investors maintain a long-term perspective. Daily fluctuations are the “price of admission” for the superior long-term returns that equities provide compared to other asset classes.
Risk Management and Portfolio Diversification
A single day of market turbulence is a reminder of the importance of asset allocation. Diversification—the practice of spreading investments across various sectors, geographies, and asset classes (such as bonds, real estate, and commodities)—is the only “free lunch” in investing. By not having all their eggs in one basket, investors can mitigate the impact of a downturn in any single sector.
Risk management also involves maintaining a cash reserve or “dry powder.” When the market has a particularly bad day, having liquidity allows an investor to purchase high-quality assets at a discount. Rather than fearing a “red” day, the prepared investor views it as a strategic opportunity to rebalance their portfolio.
The Power of Staying Invested
Historical data consistently shows that the best days in the stock market often follow the worst days. Investors who attempt to “time the market” by jumping in and out based on daily performance often miss the most significant recovery periods, which can severely diminish long-term wealth accumulation.
The question of “how the stock market is doing today” should therefore be viewed as a single data point in a much larger trend. Whether the market is reaching all-time highs or navigating a period of consolidation, the fundamental principles of investing—patience, discipline, and a focus on quality—remain the most reliable tools for financial success. By understanding the indices, the macro drivers, and the psychological landscape, investors can move past the headlines and develop a sophisticated view of the ever-changing world of finance.
aViewFromTheCave is a participant in the Amazon Services LLC Associates Program, an affiliate advertising program designed to provide a means for sites to earn advertising fees by advertising and linking to Amazon.com. Amazon, the Amazon logo, AmazonSupply, and the AmazonSupply logo are trademarks of Amazon.com, Inc. or its affiliates. As an Amazon Associate we earn affiliate commissions from qualifying purchases.