
The 30-year fixed-rate mortgage is the cornerstone of the American dream. For decades, it has served as the primary vehicle for generational wealth building, allowing millions of households to secure a stable monthly payment while building equity in an appreciating asset. However, the question of what the “average” rate actually is remains one of the most dynamic and complex queries in the world of personal finance. Mortgage rates are not static figures; they are the result of a sophisticated interplay between global bond markets, central bank policy, and the individual financial profile of the borrower.

Understanding the average 30-year fixed mortgage rate requires looking beyond a single percentage point. It involves analyzing the macroeconomic forces that push rates up or down and the microeconomic factors that determine what an individual lender will offer a specific applicant. As the financial landscape shifts, staying informed about these rates is essential for anyone looking to buy a home, refinance an existing loan, or understand the broader health of the economy.
The Mechanics of the 30-Year Fixed-Rate Mortgage
The 30-year fixed-rate mortgage is unique in its longevity and stability. Unlike adjustable-rate mortgages (ARMs), where the interest rate can fluctuate after an initial period, the fixed-rate option locks in the interest cost for the entire 360-month duration of the loan. This predictability is why it remains the most popular choice among U.S. homebuyers.
Why the 30-Year Term Dominates the Market
The primary appeal of the 30-year term is affordability. By stretching the repayment of the principal over three decades, the monthly payment is significantly lower than it would be on a 15-year or 20-year loan. This allows buyers to qualify for larger loan amounts and manage their monthly cash flow more effectively. While a 15-year mortgage offers a lower interest rate and results in less interest paid over the life of the loan, the 30-year fixed remains the standard because it balances accessibility with long-term security.
Furthermore, the 30-year fixed-rate mortgage is largely a product of government-sponsored enterprises (GSEs) like Fannie Mae and Freddie Mac. These entities purchase mortgages from lenders, package them into mortgage-backed securities (MBS), and sell them to investors. This secondary market provides the liquidity necessary for lenders to continue offering long-term, fixed-rate products even during periods of economic volatility.
The Difference Between Interest Rate and APR
When searching for the average 30-year fixed mortgage rate, borrowers often encounter two different figures: the interest rate and the Annual Percentage Rate (APR). The interest rate is the cost of borrowing the principal amount, expressed as a percentage. The APR, however, is a more comprehensive measure of the cost of the loan. It includes the interest rate plus other costs such as loan origination fees, mortgage insurance, and discount points.
When comparing “average” rates, it is crucial to look at the APR to get a true sense of the total financial commitment. A lender might advertise a lower-than-average interest rate but offset it with high closing costs, resulting in a higher APR than a competitor with a slightly higher base rate.
Macroeconomic Drivers of Mortgage Rates
Mortgage rates do not move in a vacuum. They are influenced by a variety of external factors, most notably the performance of the bond market and the actions of the Federal Reserve.
The Role of the 10-Year Treasury Yield
There is a common misconception that the Federal Reserve sets mortgage rates directly. In reality, mortgage rates are most closely correlated with the yield on the 10-year U.S. Treasury note. Investors view mortgage-backed securities and Treasury bonds as competing investment options. When the yield on the 10-year Treasury rises, mortgage rates typically follow suit to remain attractive to investors.
The “spread” between the 10-year Treasury yield and the 30-year fixed mortgage rate is a key indicator for economists. Historically, this spread averages around 1.7 to 2.0 percentage points. When the spread widens, it often indicates market uncertainty or a lack of demand for mortgage-backed securities, which can drive average rates higher even if Treasury yields remain stable.
Inflation and the Federal Reserve
Inflation is the primary enemy of fixed-income investments. Because a mortgage pays a fixed amount of interest over 30 years, the “real” value of those payments decreases as inflation rises. To compensate for this loss of purchasing power, investors demand higher interest rates when inflation is high.
The Federal Reserve influences mortgage rates through its dual mandate of price stability and maximum employment. When inflation exceeds the Fed’s 2% target, the central bank often raises the federal funds rate. While this is a short-term rate that affects credit cards and auto loans directly, it sends a signal to the broader market. A tightening cycle by the Fed usually leads to higher yields on long-term bonds, which in turn pushes the average 30-year fixed mortgage rate higher. Conversely, when the Fed moves to stimulate the economy by lowering rates, mortgage costs typically trend downward.
Individual Factors Influencing the Rate You Receive
While the “national average” provides a benchmark, the rate a specific borrower receives can vary significantly based on their unique financial situation. Lenders use a process called risk-based pricing to determine the interest rate for each applicant.

Credit Score and Debt-to-Income Ratio
The most influential factor in determining a borrower’s rate is their credit score. Lenders view the credit score as a proxy for the likelihood of default. Borrowers with scores above 740 or 760 are typically eligible for the “prime” or lowest available rates. Those with scores in the 600s may still qualify for a 30-year fixed mortgage, but they will likely be charged a higher interest rate to compensate the lender for the increased risk.
Equally important is the debt-to-income (DTI) ratio. This is the percentage of a borrower’s gross monthly income that goes toward paying debts. A lower DTI suggests that the borrower has a greater cushion to handle their mortgage payments, which can lead to better rate offers.
Loan-to-Value Ratio and Down Payments
The loan-to-value (LTV) ratio measures the amount of the mortgage relative to the appraised value of the home. A borrower putting down 20% has an LTV of 80%. Generally, the lower the LTV, the lower the risk for the lender. Borrowers who can afford a larger down payment are often rewarded with lower interest rates. Conversely, those with a down payment of less than 20% usually have to pay for Private Mortgage Insurance (PMI), which increases their APR, and they may also face higher base interest rates.
Historical Context: Navigating Highs and Lows
To understand today’s average 30-year fixed mortgage rate, one must look at where rates have been. The history of mortgage rates is a story of extreme volatility followed by periods of relative calm.
From the 1980s Peak to the 2021 Lows
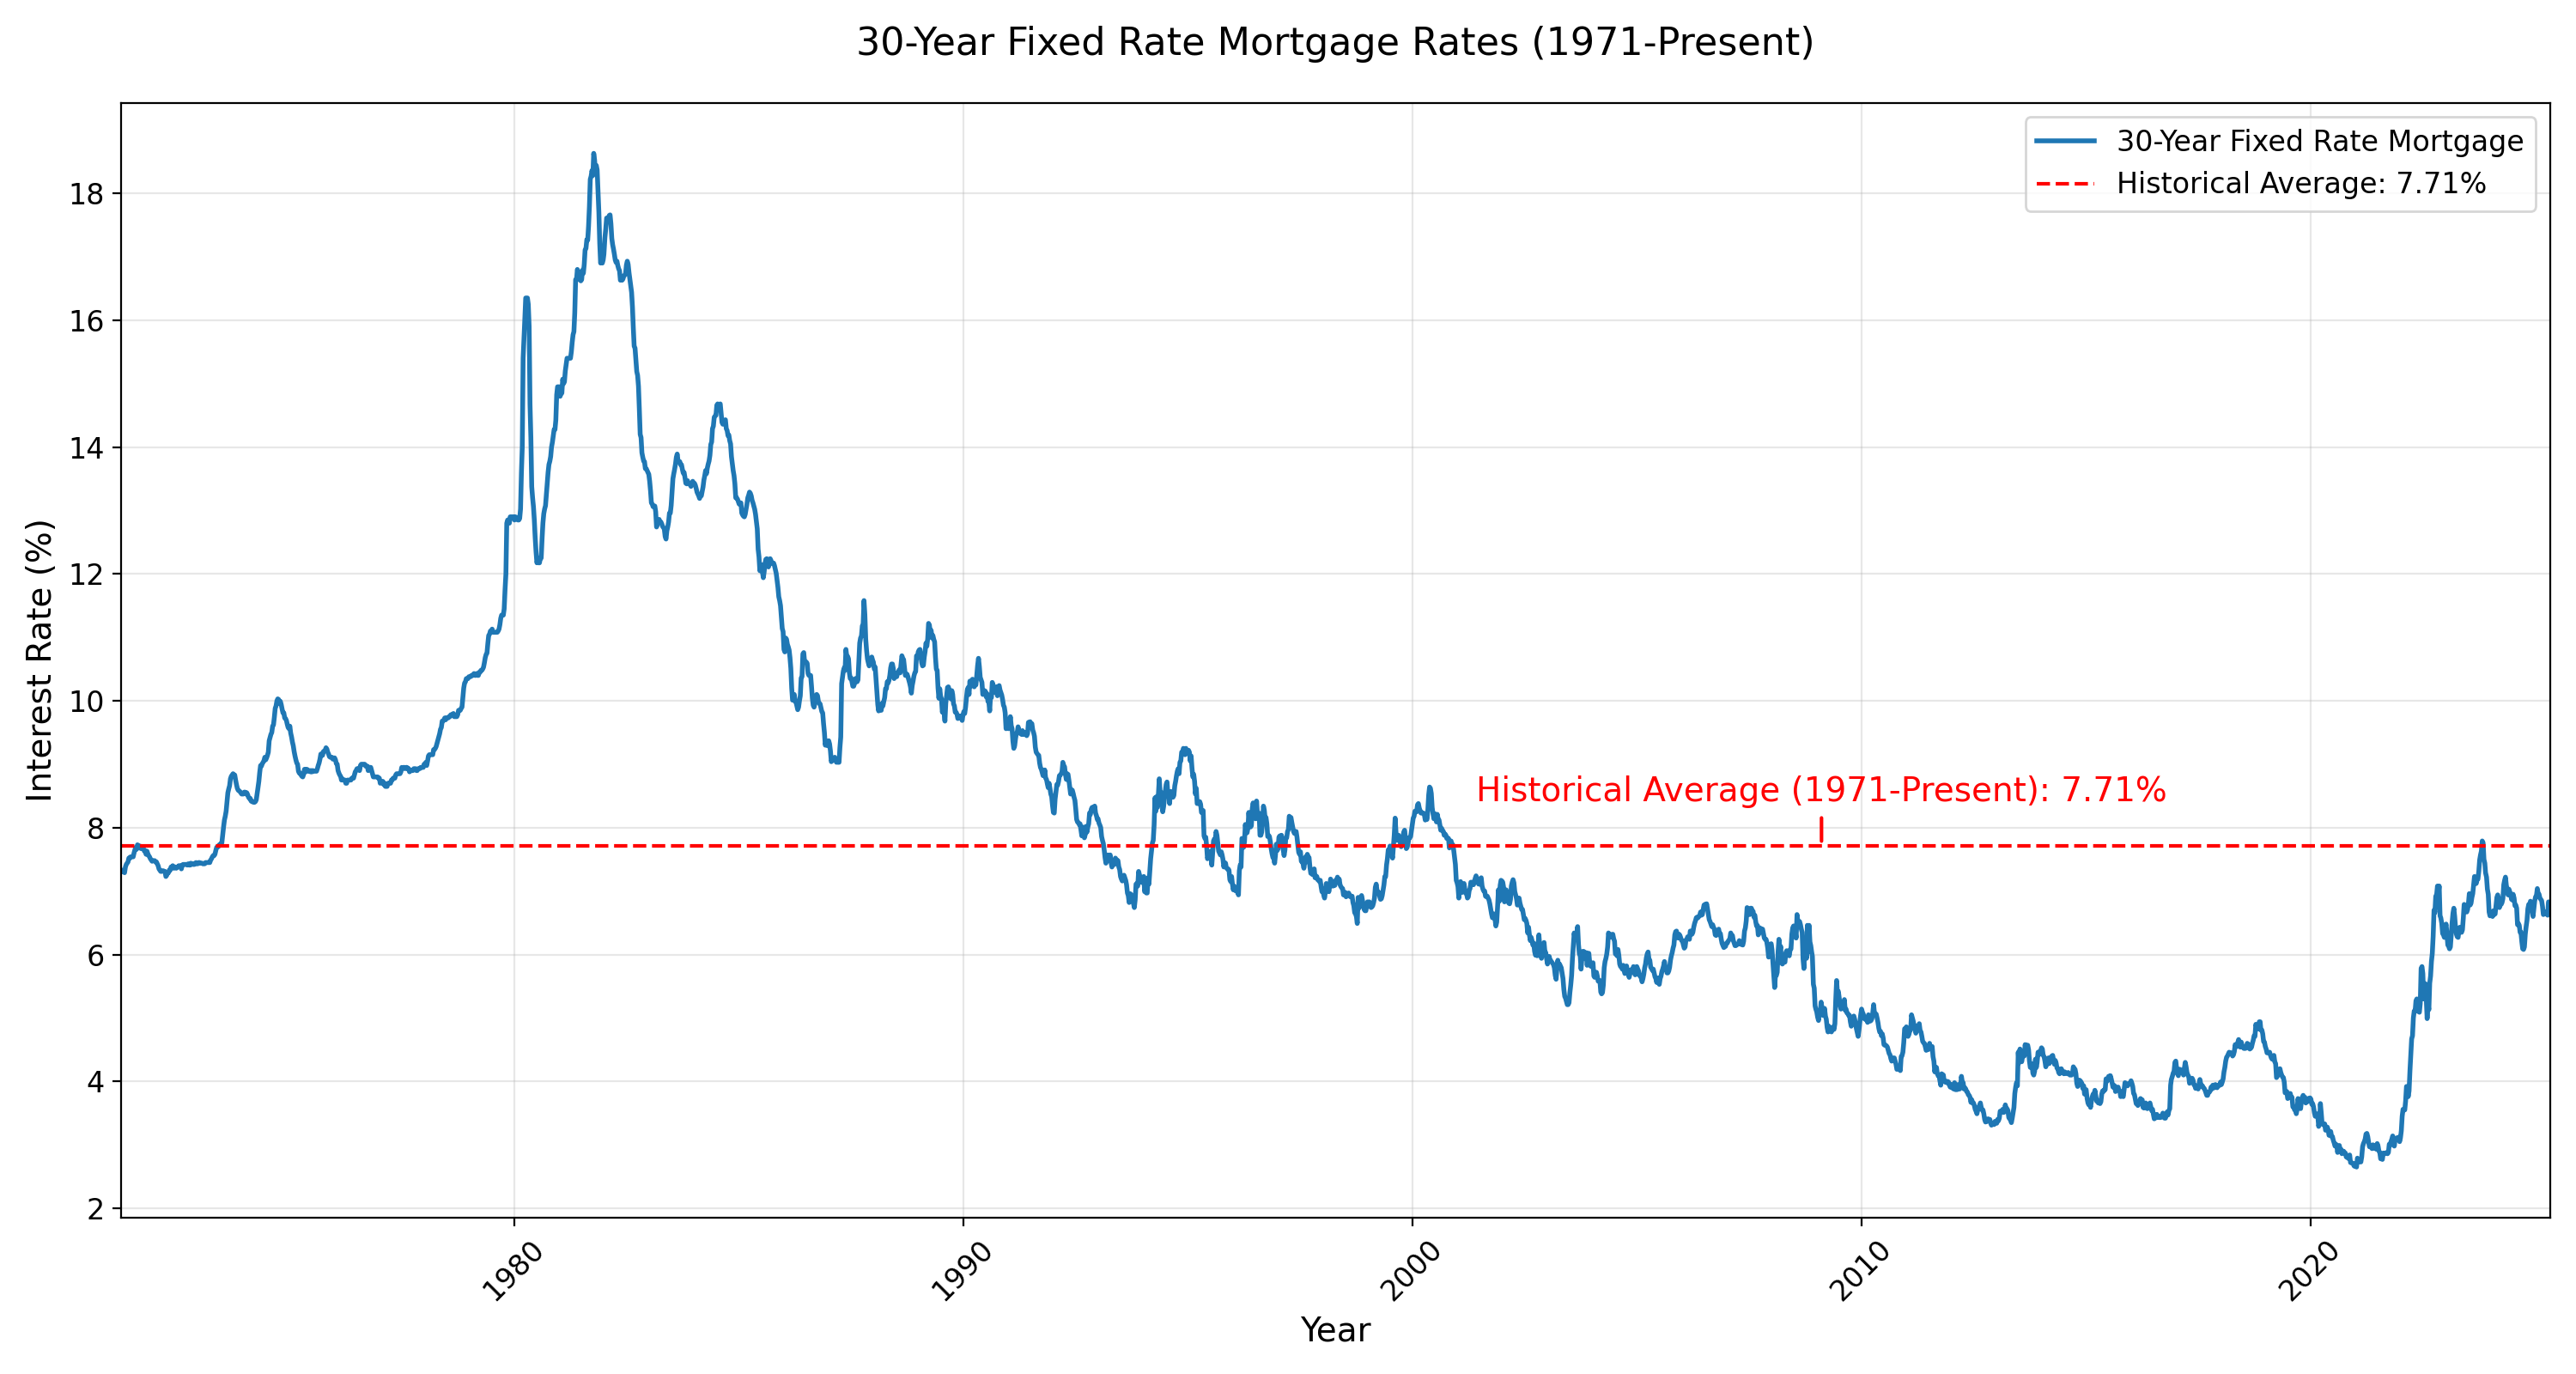
Many modern homebuyers were startled by the rapid rise of rates in the early 2020s, but historical context offers a different perspective. In the early 1980s, as the Federal Reserve fought rampant inflation, the average 30-year fixed mortgage rate peaked at over 18%. Throughout the 1990s and early 2000s, rates typically hovered between 6% and 8%.
The period following the 2008 financial crisis ushered in an era of historically low rates, as the Fed utilized quantitative easing to support the housing market. This culminated in 2021, when the average 30-year fixed rate hit an all-time low of approximately 2.65%. This “cheap money” era fueled a massive surge in home prices and a refinancing boom, but it also set the stage for the sharp correction seen when inflation returned in 2022.
The “Lock-In” Effect
The massive delta between the 3% rates of 2021 and the higher rates of subsequent years has created a phenomenon known as the “lock-in effect.” Millions of homeowners who secured sub-4% rates are reluctant to sell their homes because moving would mean taking on a new mortgage at a significantly higher rate. This has led to a shortage of inventory in the housing market, which keeps home prices elevated even as borrowing costs rise. Understanding this dynamic is crucial for buyers who are waiting for the “average” rate to drop before entering the market.
Strategic Financial Planning for Borrowers
In a fluctuating rate environment, borrowers must be strategic to ensure they are getting the best possible deal. The “average” rate is simply a starting point; the goal is to beat that average through smart financial management.
The Math of Discount Points
One way to lower a mortgage rate is by paying “points” at closing. One point typically costs 1% of the loan amount and reduces the interest rate by approximately 0.25%. Deciding whether to pay points requires a break-even analysis. A borrower must calculate how many months of lower payments it will take to recoup the upfront cost of the points. If the borrower plans to stay in the home for ten or twenty years, paying points can save tens of thousands of dollars. However, if they plan to move or refinance within a few years, it is usually better to take the higher rate and keep the cash.
Rate Locks and Timing
Because mortgage rates can change multiple times in a single day, “locking” a rate is a critical step in the home-buying process. A rate lock guarantees the interest rate for a specific period, usually 30 to 60 days, while the loan is processed. If rates rise during that period, the borrower is protected. Some lenders also offer “float-down” provisions, which allow the borrower to take advantage of a lower rate if the average drops significantly before they close on the house.
The Importance of Shopping Around
Data from the Consumer Financial Protection Bureau consistently shows that borrowers who get quotes from at least three different lenders save thousands of dollars over the life of their loan. “Average” rates vary by institution. Online lenders, credit unions, and traditional banks all have different overhead costs and risk appetites. By comparing Loan Estimates, borrowers can leverage one lender’s offer against another to secure a rate that is below the national average.
The average 30-year fixed mortgage rate is more than just a number on a chart; it is a reflection of the global economy’s pulse and a primary determinant of individual financial health. By understanding the forces that shape these rates and the strategies available to mitigate them, prospective homeowners can navigate the complexities of the real estate market with confidence and precision. Whether rates are at historic lows or trending higher, the 30-year fixed mortgage remains a powerful tool for those who understand how to use it.
aViewFromTheCave is a participant in the Amazon Services LLC Associates Program, an affiliate advertising program designed to provide a means for sites to earn advertising fees by advertising and linking to Amazon.com. Amazon, the Amazon logo, AmazonSupply, and the AmazonSupply logo are trademarks of Amazon.com, Inc. or its affiliates. As an Amazon Associate we earn affiliate commissions from qualifying purchases.