
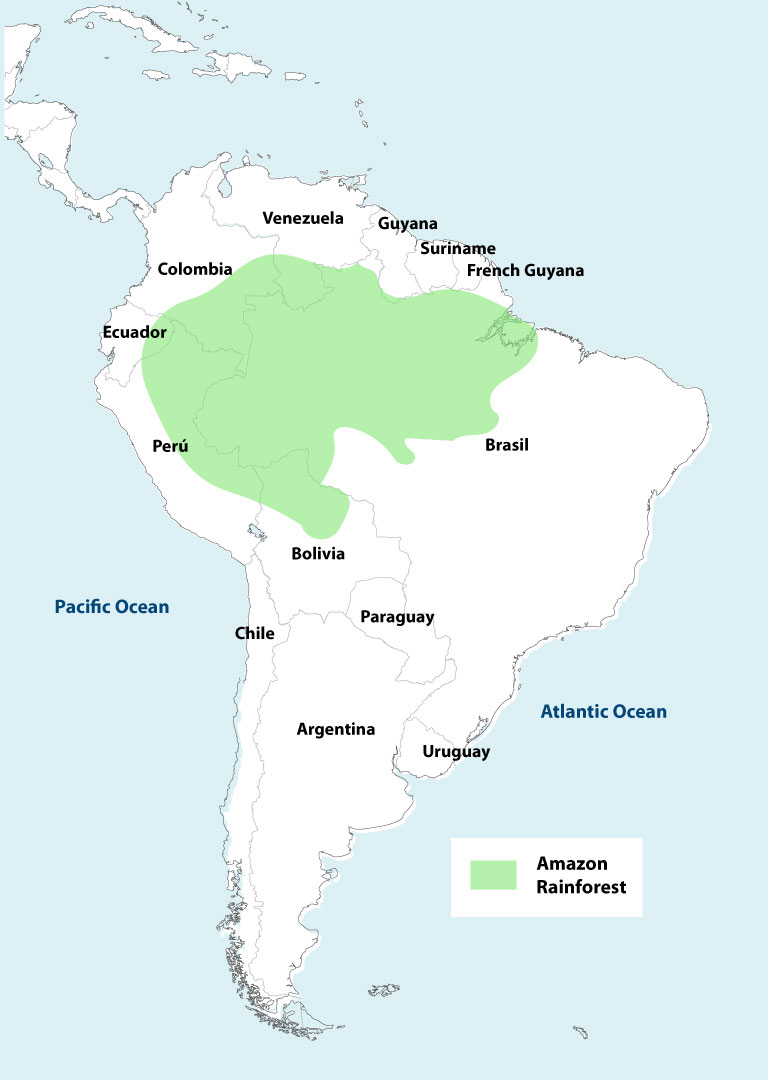
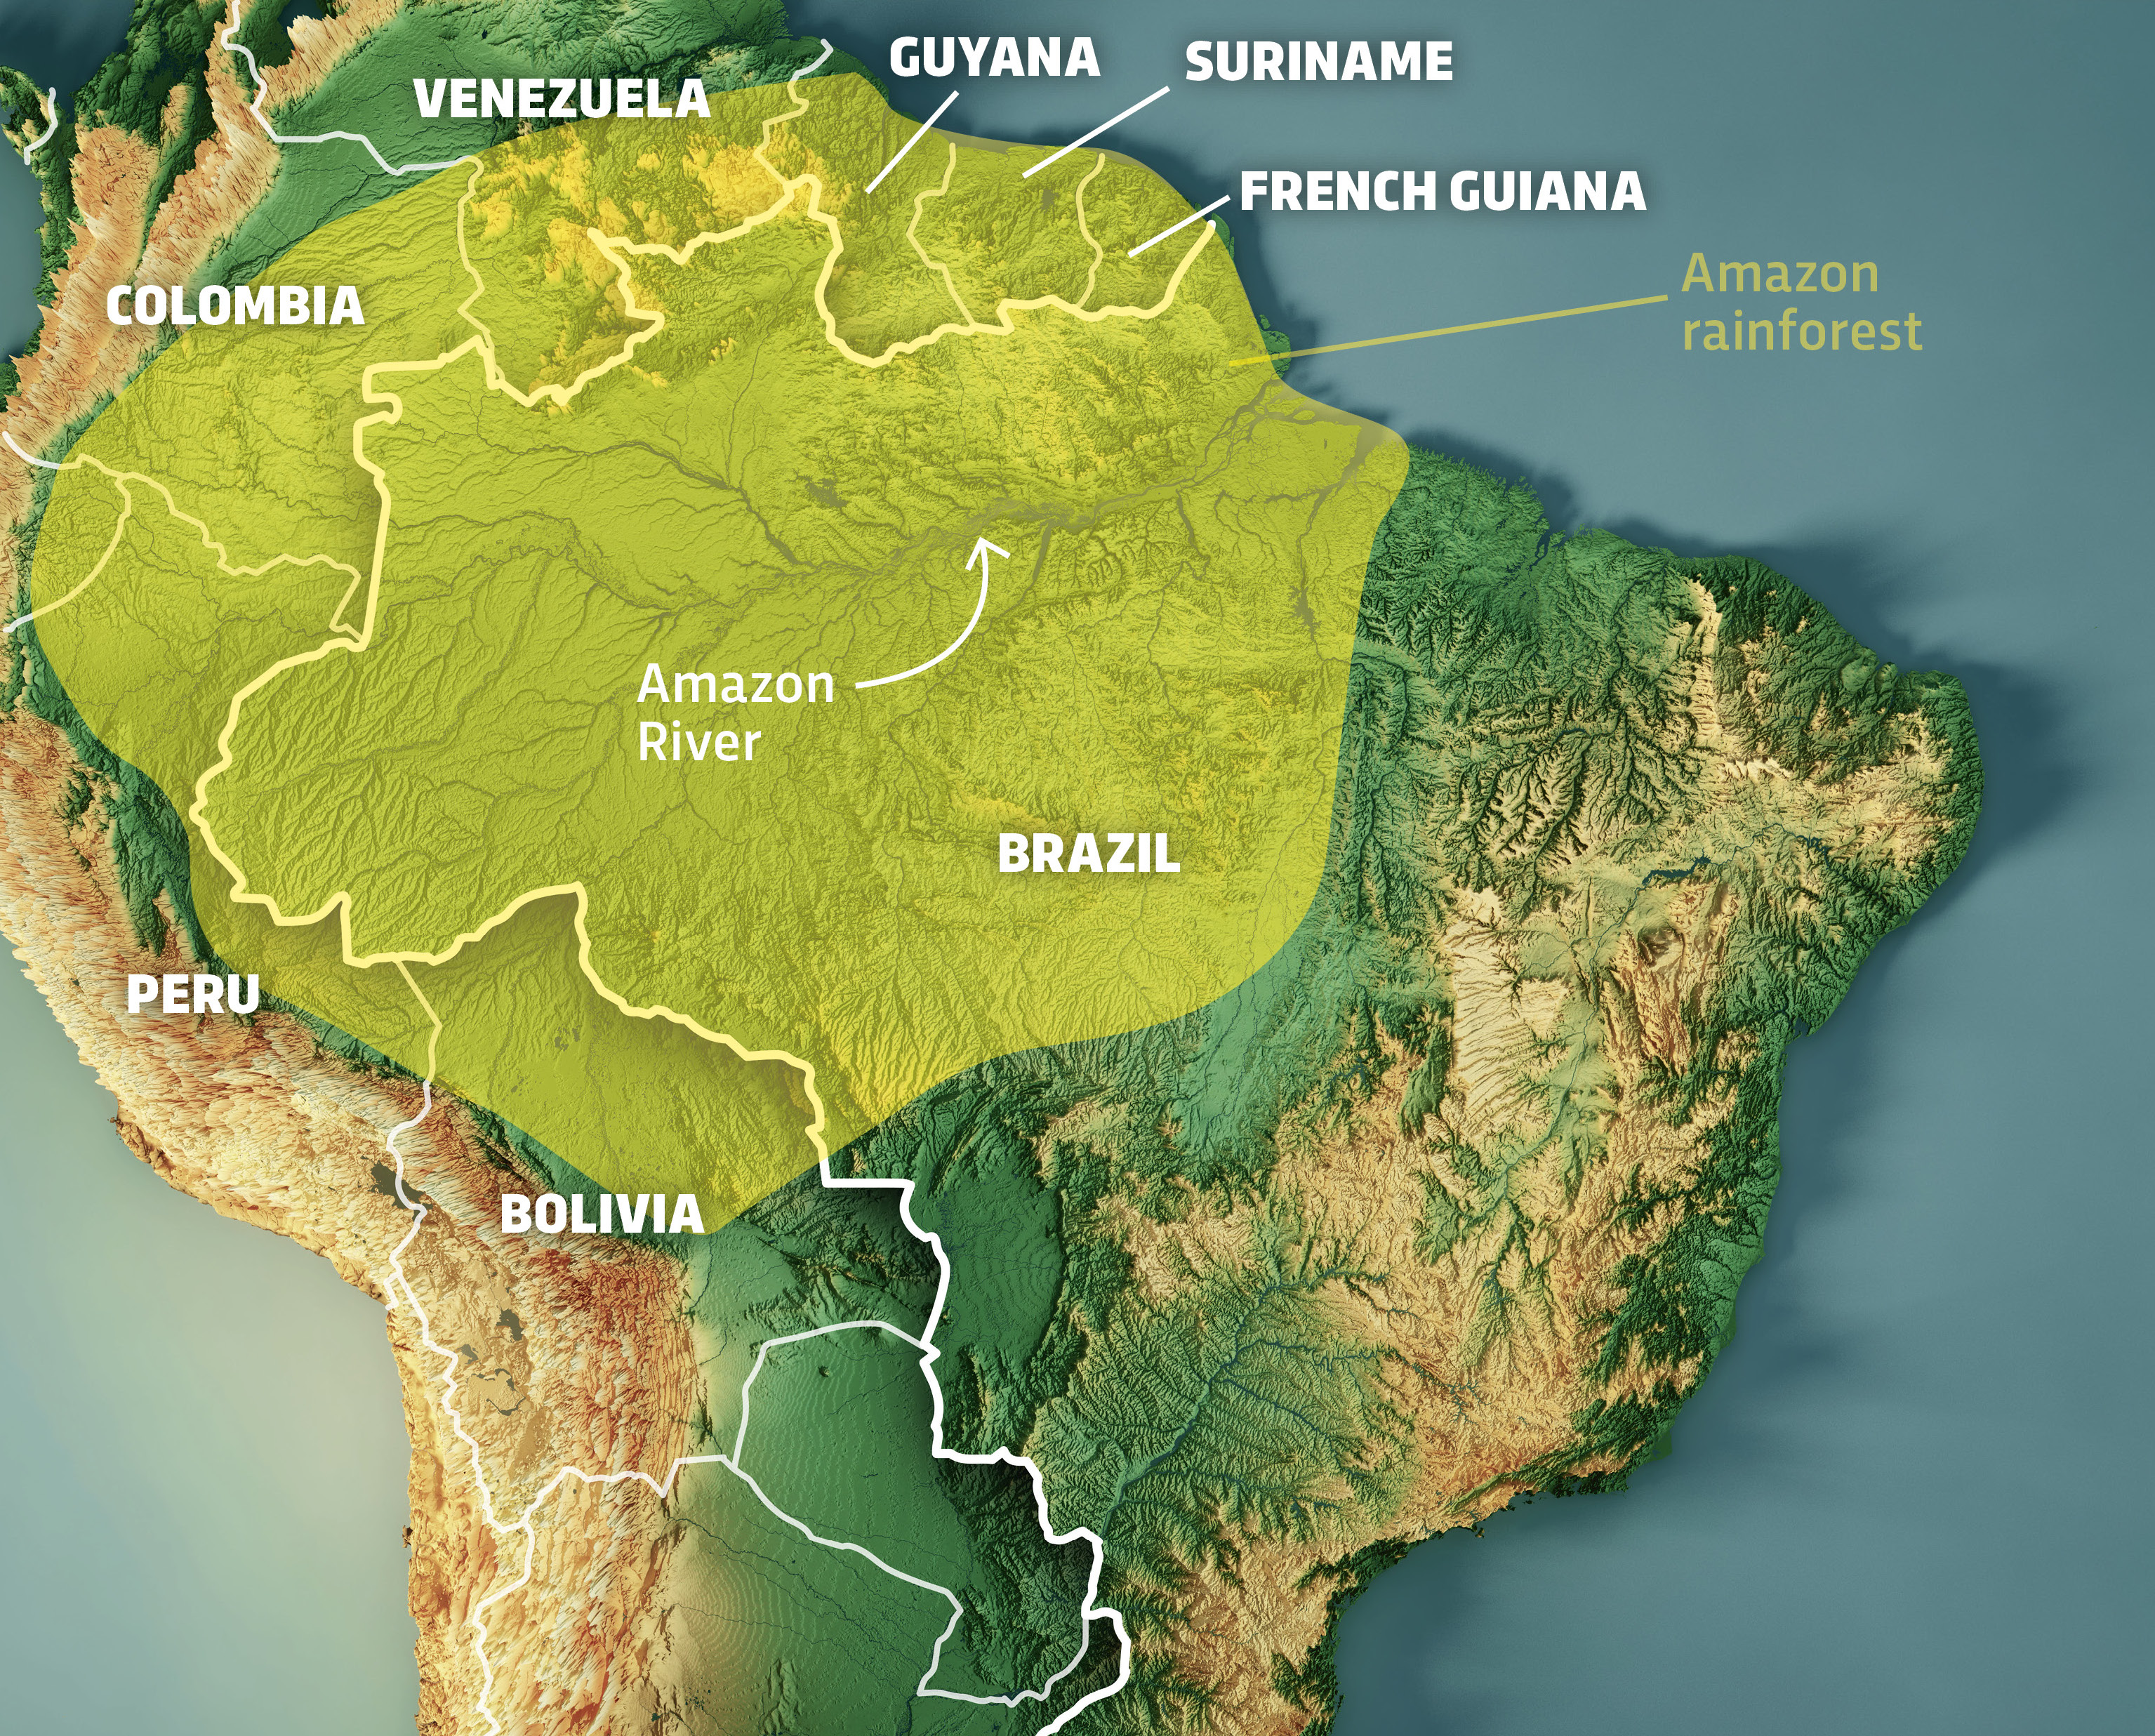
Locating the Amazon Rainforest on a map was once a matter of identifying a vast, green smudge across the northern half of South America. Spanning nine nations—Brazil, Peru, Colombia, Venezuela, Ecuador, Bolivia, Guyana, Suriname, and French Guiana—the biome covers approximately 6.7 million square kilometers. However, in the modern digital era, the question “where is the Amazon rainforest on the map” has evolved. We are no longer looking at static paper charts; we are looking at dynamic, multi-layered digital ecosystems powered by satellite telemetry, artificial intelligence, and Geographic Information Systems (GIS).
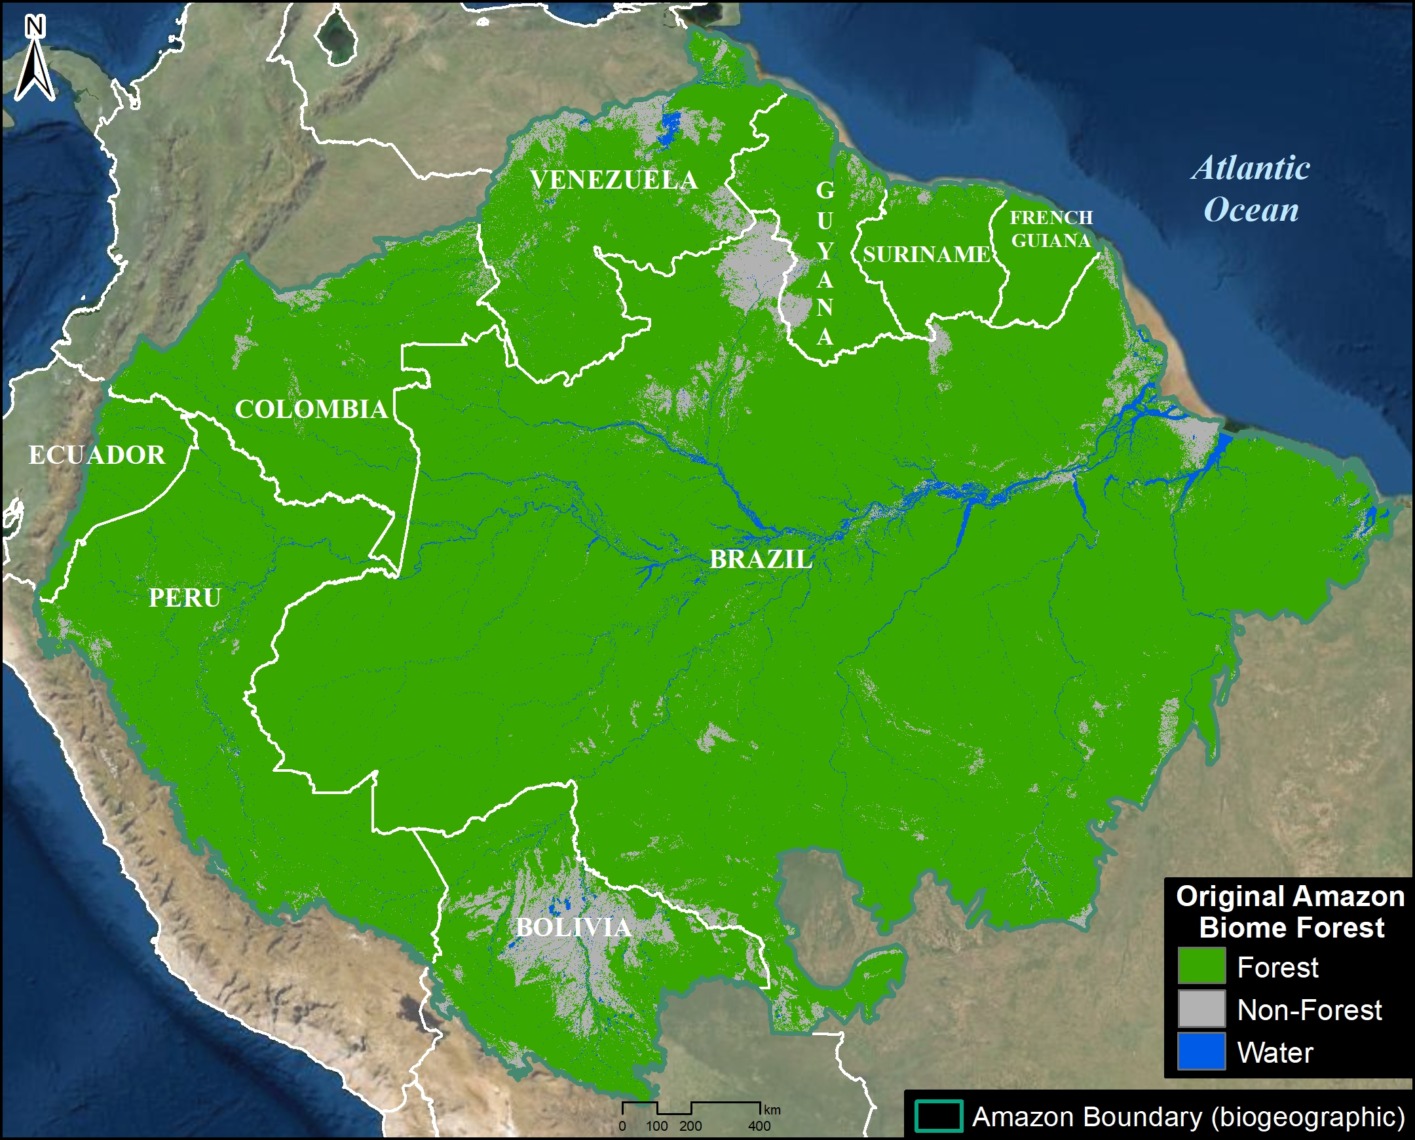
Today, identifying the rainforest’s boundaries involves real-time data streaming from low-earth orbit (LEO) satellites and sophisticated software architectures that track changes in canopy cover down to the square meter. For the technology sector, the Amazon is not just a geographical location; it is the world’s most complex data set.
The Digital Cartography of the Amazon: From Satellites to Smartphones
The transition from traditional cartography to digital spatial analysis has transformed how we visualize the Amazon. Traditional maps failed to capture the fluidity of the rainforest—the seasonal flooding, the shifting riverbanks of the Amazon River, and the rapid pace of land-use change. Modern tech has solved this through a stack of remote sensing technologies.
Remote Sensing and Optical Satellites
The primary way the Amazon is mapped today is through optical remote sensing. Programs like the USGS/NASA Landsat series and the European Space Agency’s (ESA) Copernicus Sentinel-2 provide high-resolution imagery that allows researchers to “see” the forest from space. These satellites utilize multi-spectral sensors to capture data beyond the visible spectrum. By analyzing the Near-Infrared (NIR) and Short-Wave Infrared (SWIR) bands, technologists can calculate the Normalized Difference Vegetation Index (NDVI), which identifies the health and density of vegetation. This allows the map to distinguish between a healthy primary forest and a degraded secondary growth area.
LiDAR: Seeing Through the Canopy
While optical satellites provide a top-down view, Light Detection and Ranging (LiDAR) technology has revolutionized our understanding of what lies beneath the thick Amazonian canopy. LiDAR sensors, often mounted on aircraft or increasingly on specialized satellite missions like NASA’s GEDI (Global Ecosystem Dynamics Investigation), pulse laser beams toward the earth. By measuring the time it takes for these pulses to bounce back, tech systems can create three-dimensional maps of the forest structure. This tech allows cartographers to map the forest floor, identify hidden archaeological sites, and precisely measure the biomass and carbon storage of specific sectors of the rainforest.
Geographic Information Systems (GIS) and the Real-Time Map
Locating the Amazon on a map today involves interacting with a GIS—a framework for gathering, managing, and analyzing data. GIS integrates many types of data, analyzing spatial location and organizing layers of information into visualizations using maps and 3D scenes.
Layering Data for Environmental Intelligence
A modern digital map of the Amazon is composed of dozens of layers. One layer might show political boundaries, another the indigenous territories, a third the real-time fire alerts from MODIS (Moderate Resolution Imaging Spectroradiometer), and a fourth the hydrological data of the Amazon basin. Platforms like Google Earth Engine have democratized this data, providing a cloud-based platform for geospatial analysis at a scale never before possible. Developers can write scripts to process petabytes of satellite imagery, allowing for the creation of “timelapse” maps that show forty years of rainforest evolution in seconds.
Open-Source Mapping and Community Science
One of the most significant shifts in mapping the Amazon is the move toward open-source and participatory cartography. Tools like OpenStreetMap and specialized apps like Forest Watcher allow indigenous communities and local rangers to contribute ground-truth data to the global map. Using GPS-enabled smartphones and tablets, users can upload photos and coordinates of illegal logging or new road construction. this “human-in-the-loop” data is then synced with satellite maps, providing a level of granular detail that space-based sensors might miss due to cloud cover.
AI and Machine Learning in Deforestation Tracking
The sheer volume of data generated by satellites monitoring the Amazon is too vast for human analysts to process manually. This is where Artificial Intelligence (AI) and Machine Learning (ML) become the essential tools for defining the rainforest’s current boundaries.
Predictive Modeling of Land Use
Machine learning algorithms are now trained to identify patterns of deforestation before they happen. By analyzing historical data on road expansion, proximity to markets, and agricultural trends, AI models can produce “heat maps” of areas at high risk. These predictive maps are used by NGOs and government agencies to allocate resources more effectively. For example, if an algorithm detects a “fishbone” pattern of small clearings—a classic precursor to large-scale clearing—it can trigger an automated alert system.
Identifying Illegal Mining and Logging via Computer Vision
Computer vision, a subset of AI, is used to scan thousands of satellite images daily to identify specific shapes associated with environmental degradation. Illegal gold mining operations, for instance, create distinct sediment ponds and “scars” on the landscape that look different from natural river erosion. AI models can be trained to recognize these signatures with high accuracy, updating the digital map of the Amazon to include these illegal incursions in near real-time. This tech-driven oversight creates a “transparent forest” where clandestine activities are visible to the global community.
The Role of Digital Twins in Rainforest Conservation
As we look toward the future of mapping, the concept of the “Digital Twin” is moving from urban planning into the realm of environmental science. A Digital Twin of the Amazon is a virtual representation that serves as the real-time digital counterpart of the physical forest.
Virtual Models for Climate Simulation
By integrating real-time sensor data from the “Internet of Trees” (IoT sensors placed on individual trees to measure sap flow and growth) with atmospheric data, technologists are building highly complex models. These Digital Twins allow scientists to run “what-if” scenarios. For example, a developer can simulate the impact of a 2-degree Celsius rise in global temperature on the rainfall patterns of a specific coordinate in the Amazon. This goes beyond traditional mapping; it is the creation of a predictive, four-dimensional map that includes the element of time and climate variance.
Enhancing Global Connectivity and Data Sovereignty
Mapping the Amazon also requires tackling the “dark spots” where there is no internet connectivity. The deployment of LEO satellite constellations like Starlink has begun to change the mapping landscape by providing high-speed internet to the most remote parts of the biome. This allows for the instantaneous upload of high-resolution data from the field, ensuring that the “live map” of the Amazon is as current as possible. Furthermore, blockchain technology is being explored as a tool for data sovereignty, allowing indigenous groups to own and control the mapping data of their own lands, ensuring that their knowledge is protected while still contributing to the global understanding of the rainforest’s geography.
Future Tech: The Intersection of Quantum Computing and Biodiversity Mapping
The final frontier of mapping the Amazon lies in the integration of genomic data and quantum computing. We are moving toward a map that doesn’t just show where the trees are, but where the biodiversity is.
As we sequence the DNA of the millions of species within the Amazon, this biological data is being geotagged. Mapping the “bio-complexity” of the Amazon requires immense computational power. Quantum computing holds the promise of processing these massive biological datasets, allowing us to map the genetic flow across the rainforest. This will create a “Bio-Map” that shows the corridors of migration and the hotspots of evolutionary resilience.
In conclusion, when we ask “where is the Amazon rainforest on the map,” the answer is found in a sophisticated tech stack. It is found in the petabytes of data stored in cloud servers, in the AI algorithms scanning for smoke plumes, and in the hands of indigenous protectors using GPS to defend their borders. The map of the Amazon is no longer a static image; it is a living, breathing digital organism that reflects the most advanced technological capabilities of our species. By leveraging these tools, we move closer to a future where the map is not just a tool for navigation, but a blueprint for the preservation of the planet’s most vital ecosystem.
aViewFromTheCave is a participant in the Amazon Services LLC Associates Program, an affiliate advertising program designed to provide a means for sites to earn advertising fees by advertising and linking to Amazon.com. Amazon, the Amazon logo, AmazonSupply, and the AmazonSupply logo are trademarks of Amazon.com, Inc. or its affiliates. As an Amazon Associate we earn affiliate commissions from qualifying purchases.