
The question “what is Intel stock price?” isn’t a simple query with a static answer; it’s an inquiry into a dynamic, real-time valuation of one of the most foundational companies in the technology sector. For investors, financial analysts, and even casual observers, understanding Intel’s stock price goes far beyond just knowing a number. It involves a deep dive into market mechanics, corporate finance, industry trends, and global economic forces. This article will explore the multifaceted nature of Intel’s stock valuation, providing a comprehensive framework for understanding how its price is determined and what factors influence its daily fluctuations and long-term trajectory from a purely financial perspective.
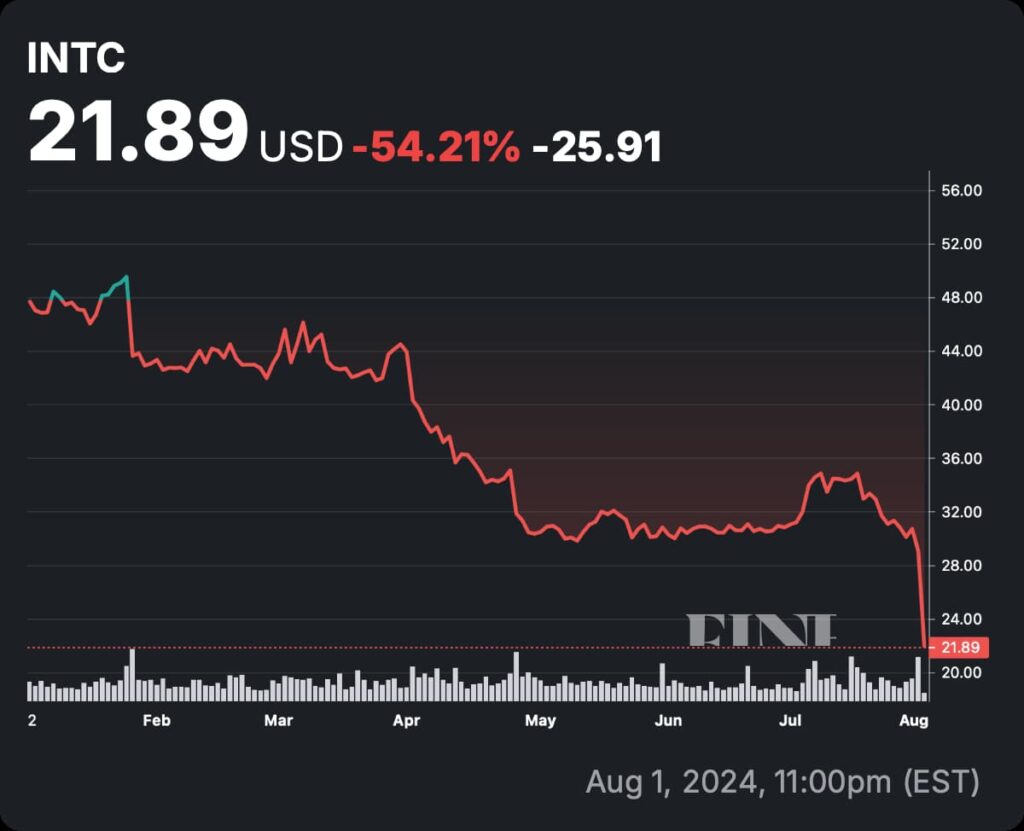
Intel, identified by its ticker symbol INTC on the NASDAQ exchange, is a bellwether for the semiconductor industry and, by extension, the broader technology landscape. Founded in 1968, it pioneered the x86 series of microprocessors, becoming synonymous with personal computing for decades. Today, while still a dominant force, Intel operates in an increasingly competitive and rapidly evolving environment, pushing into new frontiers like AI, graphics, and foundry services. Consequently, its stock price reflects not only its legacy but also the market’s perception of its future prospects and ability to execute on ambitious strategic shifts.
To truly grasp “what is Intel stock price,” one must move beyond the instantaneous quote and consider the intricate web of financial indicators, market sentiment, and strategic developments that collectively sculpt its valuation. This article will deconstruct these elements, offering an insightful perspective for anyone looking to understand the financial heartbeat of this iconic tech giant.
Decoding Intel’s Market Valuation
Understanding Intel’s market valuation begins with a foundational grasp of how its stock trades and the basic principles that drive its daily price movements. The stock market is an auction house on a massive scale, where buyers and sellers constantly negotiate, leading to a dynamic equilibrium known as the “last traded price” – what most people refer to as the stock price.
The Basics of INTC Stock
Intel’s common stock trades under the ticker symbol INTC primarily on the NASDAQ Stock Market, one of the world’s leading exchanges for technology companies. As a publicly traded company, Intel’s shares are available for purchase by individual and institutional investors, each share representing a tiny fraction of ownership in the company. The aggregate value of all outstanding shares forms Intel’s market capitalization, a critical metric that indicates the company’s size and overall market worth. For instance, if Intel has 4 billion shares outstanding and its stock price is $30 per share, its market cap would be $120 billion. This figure constantly changes with the stock price, reflecting the market’s ongoing assessment of Intel’s value.
Intel’s history as a publicly traded company is extensive, having gone public in 1971. Over five decades, it has experienced numerous economic cycles, technological revolutions, and intense competitive battles, all of which have left their mark on its stock performance. Its longevity and prominence make it a staple in many diversified investment portfolios and a subject of intense scrutiny from the financial community.
Factors Influencing Daily Price Fluctuations
The daily movements in Intel’s stock price are a complex interplay of numerous factors, many of which can shift rapidly. While the long-term trend of a stock is often driven by fundamental corporate performance, short-term volatility is fueled by a more immediate set of influences:
-
Supply and Demand: At its core, the stock price is determined by the balance between buyers and sellers. If more investors want to buy Intel shares than sell them at a given price, the price will tend to rise. Conversely, an abundance of sellers drives the price down. This imbalance can be triggered by a multitude of news events, economic data releases, or shifts in investor sentiment.
-
Broader Market Sentiment: Intel doesn’t trade in a vacuum. Its stock price is heavily influenced by the overall health of the stock market (e.g., movements in the S&P 500 or NASDAQ Composite) and the performance of its specific sector (semiconductors). A general market downturn or a sector-wide correction, perhaps due to fears of a recession or rising interest rates, can drag Intel’s stock down even if the company’s specific fundamentals remain strong.
-
Company-Specific News: Any announcement from Intel can have an immediate and significant impact on its stock. This includes quarterly earnings reports, guidance for future quarters, strategic partnerships, new product launches, mergers and acquisitions, leadership changes, or even major patent disputes. Positive news tends to boost the stock, while negative news can cause sharp declines.
-
Analyst Ratings and Media Coverage: Investment banks and financial research firms regularly publish reports and ratings on Intel. Upgrades or downgrades by influential analysts can sway investor opinion and lead to corresponding price movements. Similarly, positive or negative coverage from major financial news outlets can amplify sentiment.
-
Macroeconomic Data and Geopolitical Events: Broader economic indicators like inflation rates, GDP growth, interest rate decisions by central banks, and unemployment figures can influence investor appetite for risk and, consequently, stock prices. Geopolitical events, such as trade disputes, wars, or supply chain disruptions (particularly relevant for a global semiconductor company like Intel), can also create significant uncertainty and volatility.
-
Algorithmic Trading: A substantial portion of today’s trading volume is executed by high-frequency trading algorithms. These automated systems can react to news, price changes, and market conditions in milliseconds, often exacerbating price movements in either direction, contributing to short-term volatility.
Fundamental Analysis: A Deeper Dive into Intel’s Financial Health
While daily price movements can be erratic, the long-term trajectory of Intel’s stock price is fundamentally tied to its financial health and business performance. This is where fundamental analysis comes into play, scrutinizing the company’s financial statements and business model to determine its intrinsic value.
Key Financial Metrics to Watch
A thorough fundamental analysis of Intel involves examining a range of financial metrics that paint a picture of its operational efficiency, profitability, and solvency:
-
Revenue and Earnings Growth: These are perhaps the most straightforward indicators of a company’s success. Investors look for consistent revenue growth, signaling increasing sales, and healthy earnings per share (EPS) growth, indicating increasing profitability. Comparing Intel’s historical growth rates against industry peers and analyst expectations provides crucial context. A slowdown in growth or a miss on earnings expectations often leads to a negative market reaction.
-
Profit Margins: Intel’s gross, operating, and net profit margins reveal how efficiently the company converts its revenue into profit at various stages. Gross margin indicates the profitability of its core products, operating margin reflects efficiency after operating expenses, and net margin shows the ultimate profit after all costs, including taxes. In the capital-intensive semiconductor industry, maintaining strong margins despite significant R&D and manufacturing costs is a key challenge and a strong indicator of competitive advantage.
-
Balance Sheet Health: A robust balance sheet indicates financial stability. Key aspects to review include Intel’s debt levels versus its equity (debt-to-equity ratio), its cash and short-term investments, and its current assets versus current liabilities (current ratio). A company with manageable debt and ample cash reserves is better positioned to weather economic downturns, fund future growth initiatives, and maintain investor confidence.
-
Cash Flow: Cash is king. Analyzing Intel’s cash flow statements—specifically cash flow from operations, investing, and financing activities—provides insight into how much cash the company is generating from its core business, how much it’s investing in future growth (e.g., new fabs, R&D), and how it’s financing its operations (e.g., debt, equity, dividends). Free cash flow (FCF), which is cash flow from operations minus capital expenditures, is particularly important as it represents the cash available to shareholders, for debt repayment, or for acquisitions. Consistent FCF generation is a hallmark of a healthy, financially flexible company.
Intel’s Business Segments and Future Prospects
Beyond the numbers, understanding Intel’s current business segments and strategic direction is vital for assessing its future potential and, consequently, its stock price:
-
Client Computing Group (CCG): Historically Intel’s largest segment, focusing on CPUs for PCs. Its performance is tied to the PC market’s health and competition from rivals like AMD.
-
Data Center and AI (DCAI): Provides processors for servers, enterprise, and cloud computing. This segment is critical for Intel’s growth, especially with the explosion of AI and cloud adoption, but faces fierce competition from AMD and specialized AI accelerators from NVIDIA.
-
Network and Edge (NEX): Focuses on networking, 5G, and edge computing solutions.
-
Intel Foundry Services (IFS): A strategic pivot to become a major provider of chip manufacturing services for other companies, aiming to diversify revenue and capitalize on global demand for chip production. This segment requires massive capital investment but offers significant long-term growth potential if successful.
-
Mobileye: Develops self-driving car technology, representing Intel’s foray into the burgeoning automotive tech market.
Intel’s strategic initiatives, such as its IDM 2.0 strategy (Integrated Device Manufacturer 2.0), represent a significant effort to regain technological leadership and improve manufacturing capabilities. The market closely watches Intel’s execution on these plans, including its ability to ramp up new process technologies and secure foundry customers. Success or failure in these areas will have profound implications for its stock performance, especially given the multi-billion dollar investments involved. Competition from AMD (with its resurgent CPU and GPU lines), NVIDIA (dominating AI accelerators), and ARM-based solutions across various computing domains remains a persistent challenge and a key risk factor for Intel’s market share and profitability.
Technical Analysis and Market Sentiment for INTC
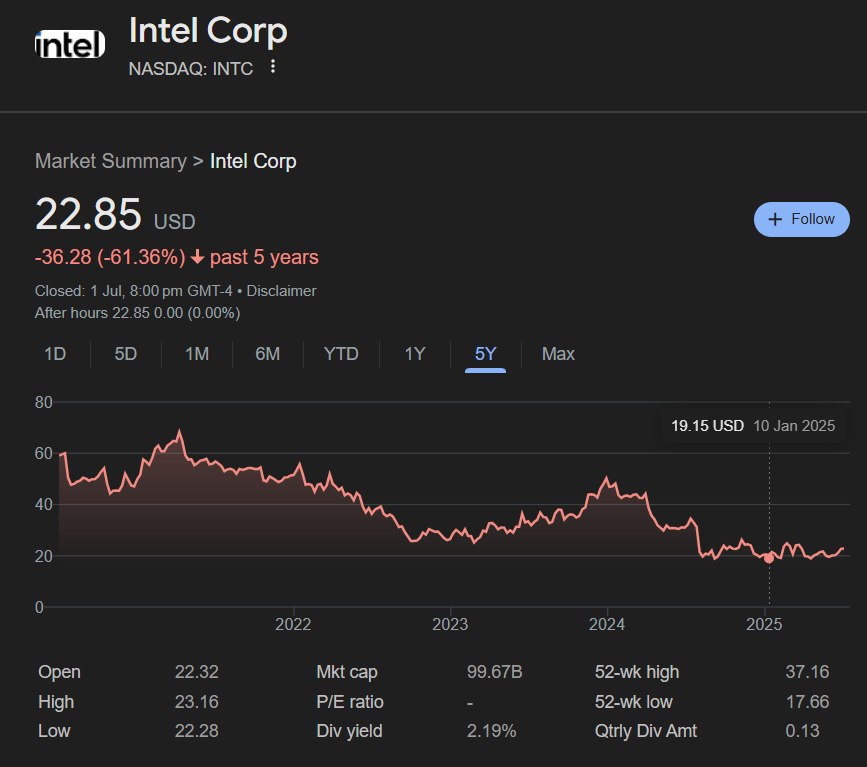
While fundamental analysis focuses on a company’s intrinsic value, technical analysis examines past market data, primarily price and volume, to forecast future price movements. Combined with an understanding of broader market sentiment, it offers a different lens through which to view Intel’s stock price.
Charting Intel’s Price Action
Technical analysts believe that all known information about a stock is already reflected in its price. By studying price charts, they identify patterns and trends to predict future direction.
-
Importance of Historical Price Charts: A look at Intel’s historical stock chart over various timeframes (daily, weekly, monthly) can reveal long-term trends, periods of consolidation, and significant price reversals. Identifying these patterns can provide clues about investor behavior.
-
Basic Indicators: Technical analysts use various indicators to help interpret price action:
-
Moving Averages: These smooth out price data to identify trends. For example, a stock trading above its 50-day and 200-day moving averages is generally considered to be in an uptrend. Crossovers of these averages can signal potential shifts in momentum.
-
Volume: The number of shares traded in a given period. High volume often confirms the strength of a price movement, while low volume can indicate a lack of conviction.
-
-
Support and Resistance Levels: These are price points where a stock has historically found difficulty moving above (resistance) or falling below (support). They are often psychological levels where buying or selling pressure is expected to increase, potentially leading to price reversals or consolidations. For Intel, identifying these levels on its chart can help traders and investors gauge potential entry and exit points.
Analyst Ratings and Investor Sentiment
Beyond the charts, understanding the collective mood of the market towards Intel is crucial. This investor sentiment is a powerful, albeit sometimes irrational, force that can drive stock prices.
-
What Analyst Ratings Mean: Research firms and investment banks employ analysts who specialize in specific sectors or companies. They regularly publish reports that include price targets and ratings (e.g., “Buy,” “Hold,” “Sell,” “Outperform,” “Underperform”). These ratings are based on their fundamental analysis, valuation models, and outlook for the company and industry. While not infallible, a consensus of analyst ratings can influence investor behavior. A stream of downgrades, for instance, can erode confidence and push the stock price down.
-
The Role of Institutional Investors: Large institutional investors, such as mutual funds, hedge funds, and pension funds, hold significant stakes in companies like Intel. Their buying and selling activity can dramatically impact the stock price due to the sheer volume of shares they trade. Monitoring changes in institutional ownership can provide insights into professional investor sentiment.
-
Retail Investor Sentiment and Social Media Influence: The rise of online trading platforms and financial social media has given individual retail investors a collective voice. While institutional investors often focus on long-term fundamentals, retail sentiment can be more reactive and susceptible to trends, news, or even speculative fervor. Discussions on forums, Reddit, and Twitter can sometimes create significant short-term price movements, though their long-term impact on a large-cap stock like Intel is typically less pronounced than for smaller companies.
Investing in Intel: Opportunities, Risks, and Considerations
Approaching Intel as an investment requires a balanced perspective, weighing its inherent opportunities against the significant risks in its highly competitive and capital-intensive industry.
The Bull Case for Intel
Despite recent challenges, a strong “bull case” can be made for Intel:
-
Established Market Leader: Intel remains a global leader in x86 CPUs, providing essential technology for countless devices and data centers worldwide. Its brand recognition, extensive patent portfolio, and decades of engineering expertise provide a substantial competitive moat.
-
Critical Infrastructure Provider: Intel’s products are foundational to cloud computing, enterprise infrastructure, and national security, making it a critical supplier that governments and major corporations rely on.
-
Potential for Turnaround and Innovation: Under new leadership and with significant investment in R&D and manufacturing (IDM 2.0), Intel is actively striving to regain its technological edge. Success in areas like AI accelerators, discrete GPUs, and its foundry services could unlock substantial future growth.
-
Attractive Valuation and Dividend: At certain points, Intel’s stock may trade at a valuation that is considered attractive relative to its historical averages or industry peers, especially during periods of pessimism. Additionally, Intel has historically paid a dividend, which can be appealing to income-focused investors, although dividend policies can change based on financial performance and strategic needs.
The Bear Case and Key Risks
Conversely, several factors contribute to the “bear case” for Intel, highlighting the inherent risks:
-
Intense Competition: Intel faces formidable rivals across all its key segments. AMD has significantly eroded its market share in client and server CPUs. NVIDIA dominates the burgeoning AI accelerator market. ARM-based solutions are gaining traction in various computing applications. This intense competition puts constant pressure on Intel’s pricing, market share, and margins.
-
High Capital Expenditure Requirements: The semiconductor manufacturing business is extraordinarily capital-intensive. Building and equipping cutting-edge fabrication plants (fabs) costs tens of billions of dollars. Intel’s IDM 2.0 strategy requires immense ongoing investment, which can strain free cash flow and reduce shareholder returns in the short to medium term.
-
Geopolitical Risks: As a global company with complex supply chains, Intel is exposed to geopolitical tensions, trade disputes, and export controls, particularly those involving the U.S., China, and Taiwan. Disruptions can impact production, sales, and profitability.
-
Execution Risk on New Strategies: While IDM 2.0 offers potential, it’s a massive undertaking. Successfully executing on new process technologies, attracting foundry customers, and launching competitive products on time and at scale are significant challenges. Failure to execute could lead to further market share losses and financial underperformance.
-
Technological Shifts: The rapid pace of technological innovation means that today’s leading technology can quickly become obsolete. Intel must continuously innovate and adapt to stay relevant in areas like advanced packaging, chiplet architectures, and emerging computing paradigms.
Diversification and Long-Term vs. Short-Term Investing
For any investor considering Intel, it is paramount to remember the principles of diversification. No single stock, regardless of its legacy or potential, should constitute an oversized portion of an investment portfolio. Investing in Intel, or any individual stock, carries specific company risk that can be mitigated by diversifying across various assets, sectors, and geographies.
Furthermore, investors must define their investment horizon and risk tolerance. Short-term trading based on technical analysis and market sentiment can be highly speculative and volatile. Long-term investing, typically spanning several years or even decades, focuses more on Intel’s fundamental business performance, strategic execution, and its ability to generate sustainable cash flows over time. For long-term investors, periods of stock price weakness might be viewed as opportunities to acquire shares at a more attractive valuation, assuming the underlying business fundamentals remain sound and the company’s strategic direction holds promise.

Conclusion
The question “what is Intel stock price?” reveals itself to be far more intricate than a mere numerical inquiry. It is a portal into the complex world of financial markets, corporate strategy, and technological innovation. Intel’s stock price, an ever-fluctuating figure, is the market’s collective verdict on the company’s present performance, its future potential, and the myriad internal and external forces shaping its destiny.
From the daily dance of supply and demand to the deeper, fundamental currents of revenue growth, profit margins, and strategic pivots, every aspect contributes to its valuation. Understanding the interplay between Intel’s core business segments, its ambitious IDM 2.0 strategy, intense competition, and broader macroeconomic trends is essential for any financial observer. Whether viewed through the lens of technical indicators or the robust framework of fundamental analysis, Intel’s stock offers a compelling case study in the dynamic nature of investing in a legacy technology giant striving to reinvent itself.
For investors, the journey with Intel stock necessitates continuous research, a critical eye, and a disciplined approach to portfolio management. The semiconductor industry is a battleground of innovation and capital, and Intel’s ability to navigate this challenging landscape will continue to define its financial performance and, consequently, its place in investor portfolios for years to come.
aViewFromTheCave is a participant in the Amazon Services LLC Associates Program, an affiliate advertising program designed to provide a means for sites to earn advertising fees by advertising and linking to Amazon.com. Amazon, the Amazon logo, AmazonSupply, and the AmazonSupply logo are trademarks of Amazon.com, Inc. or its affiliates. As an Amazon Associate we earn affiliate commissions from qualifying purchases.