
In the rapidly evolving landscape of technology, where innovation is constant and data reigns supreme, understanding cause and effect is paramount. Whether you’re a software engineer optimizing an algorithm, a product manager iterating on a user interface, or a data scientist building predictive models, a fundamental concept guides your pursuit of improvement: the dependent variable. It is the core metric, the measured outcome, the effect you are observing or trying to influence. In a world driven by metrics and evidence-based decisions, identifying, defining, and meticulously tracking the dependent variable is not just good practice – it’s the bedrock of informed progress and strategic advantage. This article delves into the crucial role of dependent variables within the tech ecosystem, illustrating how this scientific principle empowers innovation, refines products, and drives meaningful outcomes across software development, AI, and user experience.

The Core Concept: Understanding Dependent Variables in Tech
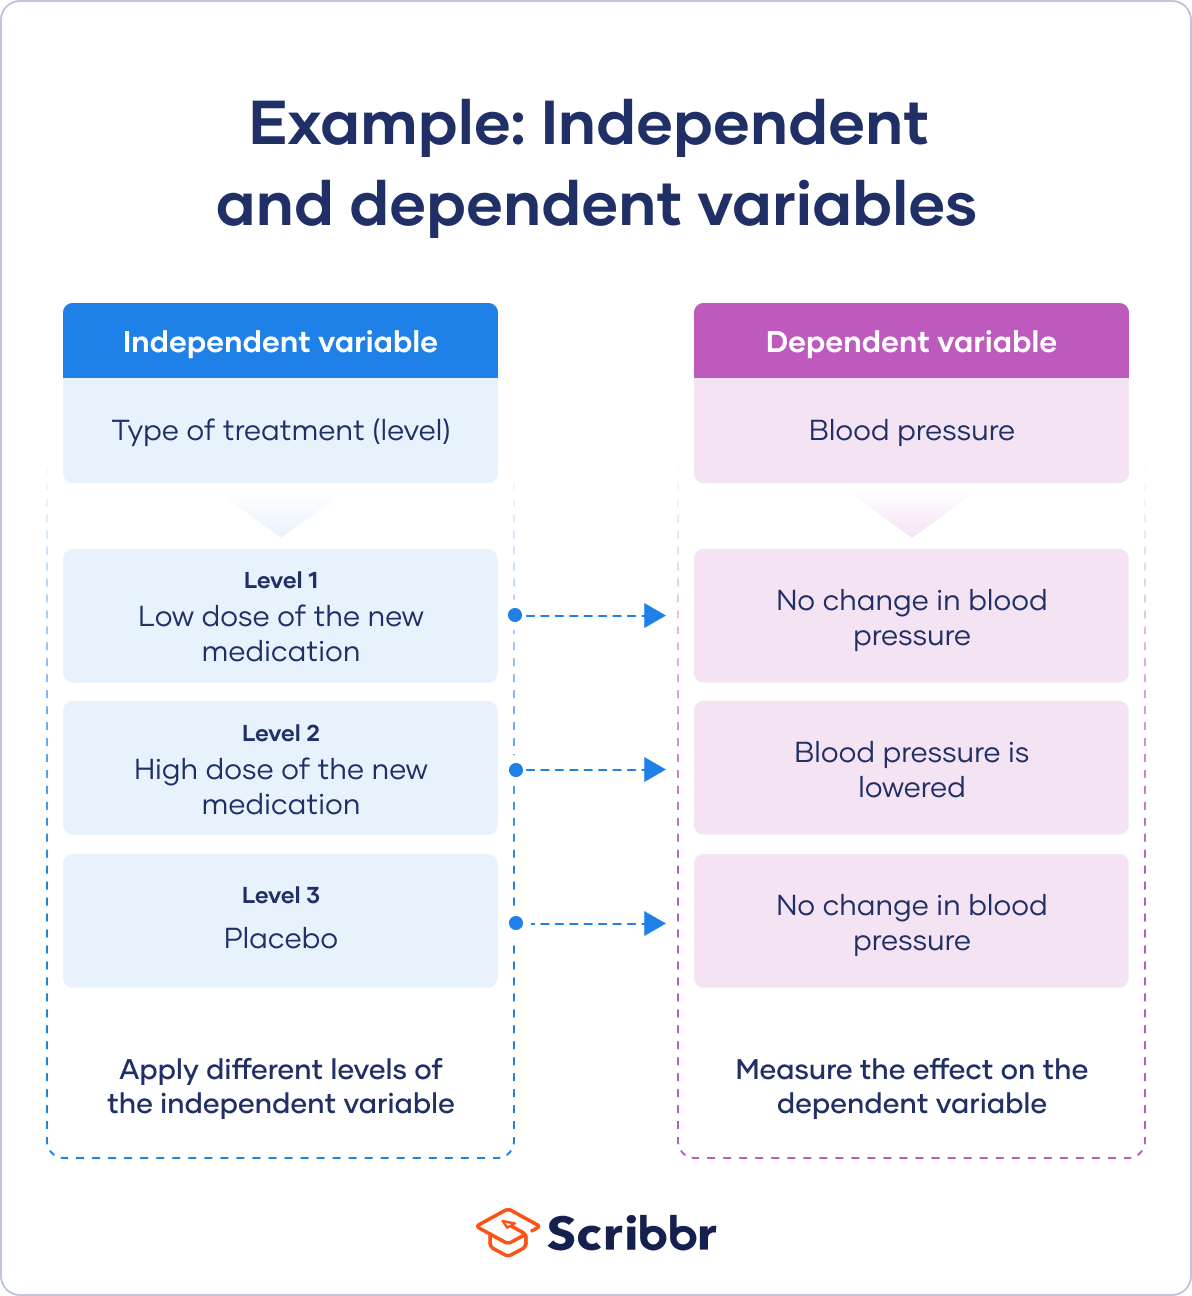
At its heart, the dependent variable is the “what” you’re trying to measure or observe. It’s the outcome that is hypothesized to be influenced by an independent variable – the “how” or “why” you’re manipulating. In technology, where experimentation and data-driven iterations are the norm, this distinction is crucial for validating hypotheses, optimizing performance, and making informed decisions.
Defining the Unwavering Metric
A dependent variable (DV) is the characteristic or value that changes in response to another variable. It’s the effect in a cause-and-effect relationship. Think of it as the metric that “depends” on other factors. For instance, if you’re testing a new website design, the “conversion rate” (how many visitors complete a desired action) might be your dependent variable, as it’s expected to change based on the “new design” (your independent variable). In the realm of machine learning, the “accuracy” of a model’s predictions is a dependent variable, influenced by factors like the “training data size” or the “algorithm choice.”
The key is that the dependent variable is the one being measured, observed, or recorded. It’s the result. Its counterpart, the independent variable (IV), is the one that is changed or controlled by the researcher or experimenter. Understanding this symbiotic relationship is the first step towards robust experimentation and analysis in any tech domain. Without a clearly defined dependent variable, any effort to measure impact or improvement becomes speculative and unreliable.
Why It Matters for Tech Professionals
For anyone working in tech, the ability to identify and leverage dependent variables is a superpower. It translates abstract ideas into measurable outcomes, transforming subjective opinions into objective data points. For product managers, DVs help validate feature efficacy; for engineers, they quantify performance gains; for data scientists, they serve as the target for predictive models.
Consider the development of a new mobile app feature. Without a clearly defined dependent variable, how would you know if the feature is successful? Is it “user satisfaction”? “Time spent in the app”? “Number of engagements”? Each of these could be a dependent variable, and each requires a different approach to measurement and analysis. By precisely defining what success looks like in terms of a measurable outcome, tech professionals can:
-
Validate Hypotheses: Rigorously test assumptions about how changes will impact user behavior or system performance.
-
Prioritize Development: Focus resources on features and optimizations that demonstrably move key metrics.
-
Iterate Effectively: Learn from experimental results to refine products and services continuously.
-
Communicate Impact: Present clear, data-backed evidence of their work’s value to stakeholders.
In essence, dependent variables provide the empirical foundation necessary to navigate the complexities of modern tech development, moving beyond guesswork to data-driven certainty.
Dependent Variables in Software Development and UX
Software development and user experience (UX) design are inherently iterative processes, driven by the continuous pursuit of improvement. Every new feature, every design tweak, and every bug fix is an implicit experiment designed to achieve a specific outcome. Dependent variables are the lenses through which these outcomes are observed and measured.
Measuring User Experience and Engagement
In UX, dependent variables are often directly tied to user behavior and satisfaction. When an A/B test is conducted on a website or app, for instance, designers are typically trying to determine which version leads to better outcomes.
Common dependent variables in UX research and A/B testing include:
-
Conversion Rate: The percentage of users who complete a desired action (e.g., making a purchase, signing up for a newsletter, downloading an app). This is a primary DV for e-commerce sites and lead generation platforms.
-
Click-Through Rate (CTR): The percentage of users who click on a specific element (button, link, ad). Useful for evaluating the effectiveness of calls-to-action or navigational elements.
-
Time on Page/Session Duration: How long users spend engaging with a particular page or the application overall. Often used to gauge engagement and content relevance.
-
Bounce Rate: The percentage of visitors who leave a website after viewing only one page. A lower bounce rate is often a dependent variable indicating improved content or navigation.
-
Churn Rate: The rate at which customers stop using a service or product. A crucial DV for subscription-based services, aiming to reduce it through product improvements.
-
Task Completion Rate: The percentage of users who successfully complete a specific task within an application.
By defining these as dependent variables, UX designers and product managers can quantify the impact of design changes, content updates, or new feature introductions, ensuring that decisions are guided by actual user behavior rather than intuition alone.
Gauging Application Performance and Reliability
Beyond user-facing metrics, dependent variables are critical for evaluating the underlying health and efficiency of software systems. Engineers consistently monitor and optimize performance, and the success of these efforts is measured against specific DVs.
Key performance-related dependent variables include:
-
Page Load Time/Latency: The time it takes for a web page or application to load or respond to a user action. Faster load times are almost always a desired DV.
-
Error Rates: The frequency of system errors, crashes, or bugs. A lower error rate is a key DV for software reliability and stability.
-
Resource Utilization: Metrics like CPU usage, memory consumption, or network bandwidth. Optimizing code or infrastructure aims to reduce resource usage while maintaining functionality.
-
Uptime/Availability: The percentage of time a system is operational and accessible. A critical DV for any service-oriented application, where downtime directly impacts user trust and business continuity.
-
Throughput: The number of transactions or requests a system can process per unit of time. An important DV for high-volume applications and APIs.
By tracking these DVs, engineering teams can pinpoint bottlenecks, validate the efficacy of architectural changes, and ensure that their software meets stringent performance and reliability standards.
Iterative Product Development and Feature Rollouts
The modern approach to product development is iterative, marked by continuous cycles of building, measuring, and learning. Dependent variables are the ‘measuring’ component, providing the feedback loop essential for smart iteration. When a new feature is rolled out, its success isn’t just assumed; it’s meticulously tested against a predefined dependent variable.
For example, if a team introduces a new onboarding flow, the dependent variable might be “first-week user retention.” If a search algorithm is updated, the dependent variable could be “relevance of search results” (measured via click-throughs on top results or user satisfaction surveys). This systematic approach allows teams to quickly identify what works, what doesn’t, and why, enabling them to pivot, refine, or even abandon features based on empirical evidence rather than gut feelings. This agility, powered by clear dependent variables, is a cornerstone of competitive product development in the tech industry.
Powering AI and Machine Learning with Dependent Variables
In the realm of Artificial Intelligence and Machine Learning, the concept of a dependent variable takes on a particularly central role. It is, quite literally, what most supervised learning models are designed to predict or classify. The entire process of model development, from training to evaluation and deployment, revolves around optimizing for specific dependent variables.
Training and Evaluating Models
In supervised machine learning, the dependent variable is often referred to as the “target variable,” “label,” or “outcome.” This is the specific feature in your dataset that the model learns to predict based on the other features (independent variables). For instance, in a fraud detection system, the dependent variable would be whether a transaction is “fraudulent” or “legitimate.” In a recommendation engine, it might be the “likelihood of a user clicking on a recommended item.”
Once a model is trained, its performance is evaluated against a set of carefully chosen dependent variables, often called evaluation metrics. These metrics quantify how well the model’s predictions align with the actual outcomes. Common dependent variables for model evaluation include:
-
Accuracy: The proportion of correct predictions out of all predictions.
-
Precision: Of all positive predictions, how many were actually correct.
-
*Recall (Sensitivity):* Of all actual positive cases, how many were correctly identified.
-
F1-Score: The harmonic mean of precision and recall, useful when class distribution is imbalanced.
-
Mean Squared Error (MSE) / Root Mean Squared Error (RMSE): Used for regression tasks, measuring the average magnitude of the errors between predicted and actual values.
-
Area Under the Receiver Operating Characteristic Curve (AUC-ROC): Measures the ability of a classifier to distinguish between classes.
These dependent variables provide quantifiable measures of a model’s effectiveness, guiding data scientists in hyperparameter tuning, feature engineering, and model selection. Without clearly defined DVs, evaluating and improving complex AI systems would be a subjective, impossible task.
Optimizing Algorithms and Hyperparameters
Beyond just evaluating models, dependent variables are the guiding stars for optimizing them. Every tweak to an algorithm, every change to a model’s architecture, and every adjustment to a hyperparameter (e.g., learning rate, number of layers, regularization strength) is an independent variable designed to impact a specific dependent variable.
For example, a data scientist might conduct an experiment where they vary the “learning rate” (independent variable) of a neural network to see how it affects the “validation accuracy” (dependent variable). Similarly, comparing different “optimization algorithms” (independent variable) for a task would involve measuring their impact on the “time to convergence” or “final error rate” (dependent variables). This systematic experimentation, driven by clearly identified DVs, is crucial for squeezing out maximal performance from AI models and ensuring they are fit for purpose.
Understanding AI’s Impact in Real-World Scenarios
Ultimately, the goal of deploying AI is to achieve tangible real-world benefits. Here, dependent variables move beyond technical metrics to encompass business and operational outcomes. The true success of an AI system is measured by its impact on the organization’s goals.
Examples of real-world dependent variables influenced by AI deployment include:
-
Increased Sales/Revenue: For recommendation engines or personalized marketing AI.
-
Reduced Fraud Incidents: For AI-powered fraud detection systems.
-
Improved Operational Efficiency: For AI automating tasks or optimizing logistics.
-
Enhanced Customer Satisfaction: For AI-powered chatbots or sentiment analysis tools.
-
Decreased Energy Consumption: For AI optimizing resource management in data centers.
By rigorously defining these high-level dependent variables, organizations can move beyond the hype and objectively assess the ROI of their AI investments, ensuring that technological prowess translates into genuine business value.
Best Practices for Identifying and Utilizing Dependent Variables
Leveraging dependent variables effectively is a skill that distinguishes truly data-driven tech professionals and organizations. It requires thoughtful planning, precise definition, and a disciplined approach to measurement and analysis.
Clarity and Specificity are Key
The most critical best practice is to ensure your dependent variables are crystal clear and specific. Vague DVs lead to ambiguous results and wasted effort. Instead of “improve user experience,” define it as “increase the average session duration by 15%.” Instead of “make the app faster,” specify “reduce average API response time by 200ms.”
-
Make them Quantifiable: Ensure the DV can be measured numerically.
-
Make them Actionable: The DV should directly relate to a goal that can be influenced by your independent variables.
-
Avoid Ambiguity: Everyone on the team should have the same understanding of what the DV represents and how it’s measured.
Establishing Baseline Metrics
Before introducing any changes or running an experiment, always measure the current state of your dependent variable. This “baseline” provides the necessary context to determine whether your intervention had any meaningful impact. Without a baseline, it’s impossible to discern if observed changes are due to your actions or simply random fluctuations. For example, if you want to improve user conversion, first measure your current conversion rate over a significant period. Only then can you accurately assess the impact of a new design or feature.
The Role of Data Collection and Analytics
Effective utilization of dependent variables hinges on robust data collection and analytics infrastructure. You need reliable mechanisms to capture the data points that constitute your DVs. This often involves:
-
Telemetry and Logging: Instrumented code to capture user actions, system performance, and errors.
-
Analytics Platforms: Tools like Google Analytics, Mixpanel, or custom dashboards for tracking user behavior.
-
Monitoring Systems: Tools for tracking server metrics, network latency, and application health.
-
A/B Testing Frameworks: Platforms that facilitate controlled experiments and automatically track DVs.
Investing in quality data infrastructure ensures that your dependent variables are accurately measured, providing trustworthy insights for decision-making.
Avoiding Common Pitfalls
Even with clear definitions and robust data, several pitfalls can undermine the utility of dependent variables:
-
Confounding Variables: Uncontrolled external factors that influence the dependent variable, making it difficult to attribute changes solely to the independent variable. Rigorous experimental design and control groups help mitigate this.
-
Correlation vs. Causation: Just because two variables move together (correlate) doesn’t mean one causes the other. Experiments are designed to establish causation by manipulating the independent variable and observing the dependent variable in a controlled environment.
-
Misinterpreting Results: Incorrectly drawing conclusions from data, such as assuming statistical significance when none exists, or overlooking practical significance. A solid understanding of statistical principles is crucial.
-
Choosing the Wrong DV: Selecting a dependent variable that doesn’t truly reflect the intended outcome or business goal. This often stems from a lack of clarity in objectives.
By being mindful of these challenges, tech professionals can enhance the integrity of their experiments and the reliability of their insights.

Conclusion
In the relentless pursuit of innovation and efficiency that defines the tech industry, the dependent variable emerges as more than just a statistical term; it is the compass guiding every experiment, every optimization, and every strategic decision. From fine-tuning a user interface to training a sophisticated AI model, identifying and precisely measuring the outcome we seek to influence is the fundamental step towards genuine progress. It provides the empirical lens through which we validate hypotheses, quantify impact, and transform abstract ideas into tangible results.
Embracing a data-driven culture, with dependent variables at its core, empowers tech teams to move beyond guesswork and subjective opinions. It fosters a rigorous, scientific approach to development, ensuring that every iteration, every feature, and every algorithm contributes meaningfully to user satisfaction, system performance, and ultimately, business success. As technology continues its rapid evolution, the ability to clearly define “what’s the dependent variable” will remain an indispensable skill, separating those who merely create from those who truly innovate with purpose and measurable impact.
aViewFromTheCave is a participant in the Amazon Services LLC Associates Program, an affiliate advertising program designed to provide a means for sites to earn advertising fees by advertising and linking to Amazon.com. Amazon, the Amazon logo, AmazonSupply, and the AmazonSupply logo are trademarks of Amazon.com, Inc. or its affiliates. As an Amazon Associate we earn affiliate commissions from qualifying purchases.