
In an increasingly data-driven world, understanding the basics of statistics isn’t just for mathematicians or data scientists; it’s a critical skill for anyone managing money, whether personally or professionally. When we talk about “mean, median, mode, and range,” we’re delving into the fundamental tools that help us make sense of numerical data. For your finances, these aren’t abstract concepts but powerful lenses through which to view your income, expenses, investments, and business performance. They provide clarity, highlight trends, and reveal the underlying story behind the numbers.
Far from being mere academic definitions, these statistical measures are the bedrock of sound financial analysis. They help you answer crucial questions: What’s my typical monthly expense? How volatile is my investment portfolio? What’s the most common price for a specific product in my market? What’s the spread of salaries for a particular role? By grasping these four measures, you gain a significant advantage in budgeting, investing, managing business operations, and ultimately, building a more robust financial future.

This article will demystify mean, median, mode, and range, explaining each concept in detail and, more importantly, demonstrating their invaluable application across various aspects of personal finance, investment strategy, and business financial management.
Demystifying the Core Concepts of Financial Data
Before we dive into their financial applications, let’s establish a clear understanding of what each statistical measure represents. Think of them as different ways to summarize a set of numbers, each offering a unique perspective.
Mean: The Financial Average
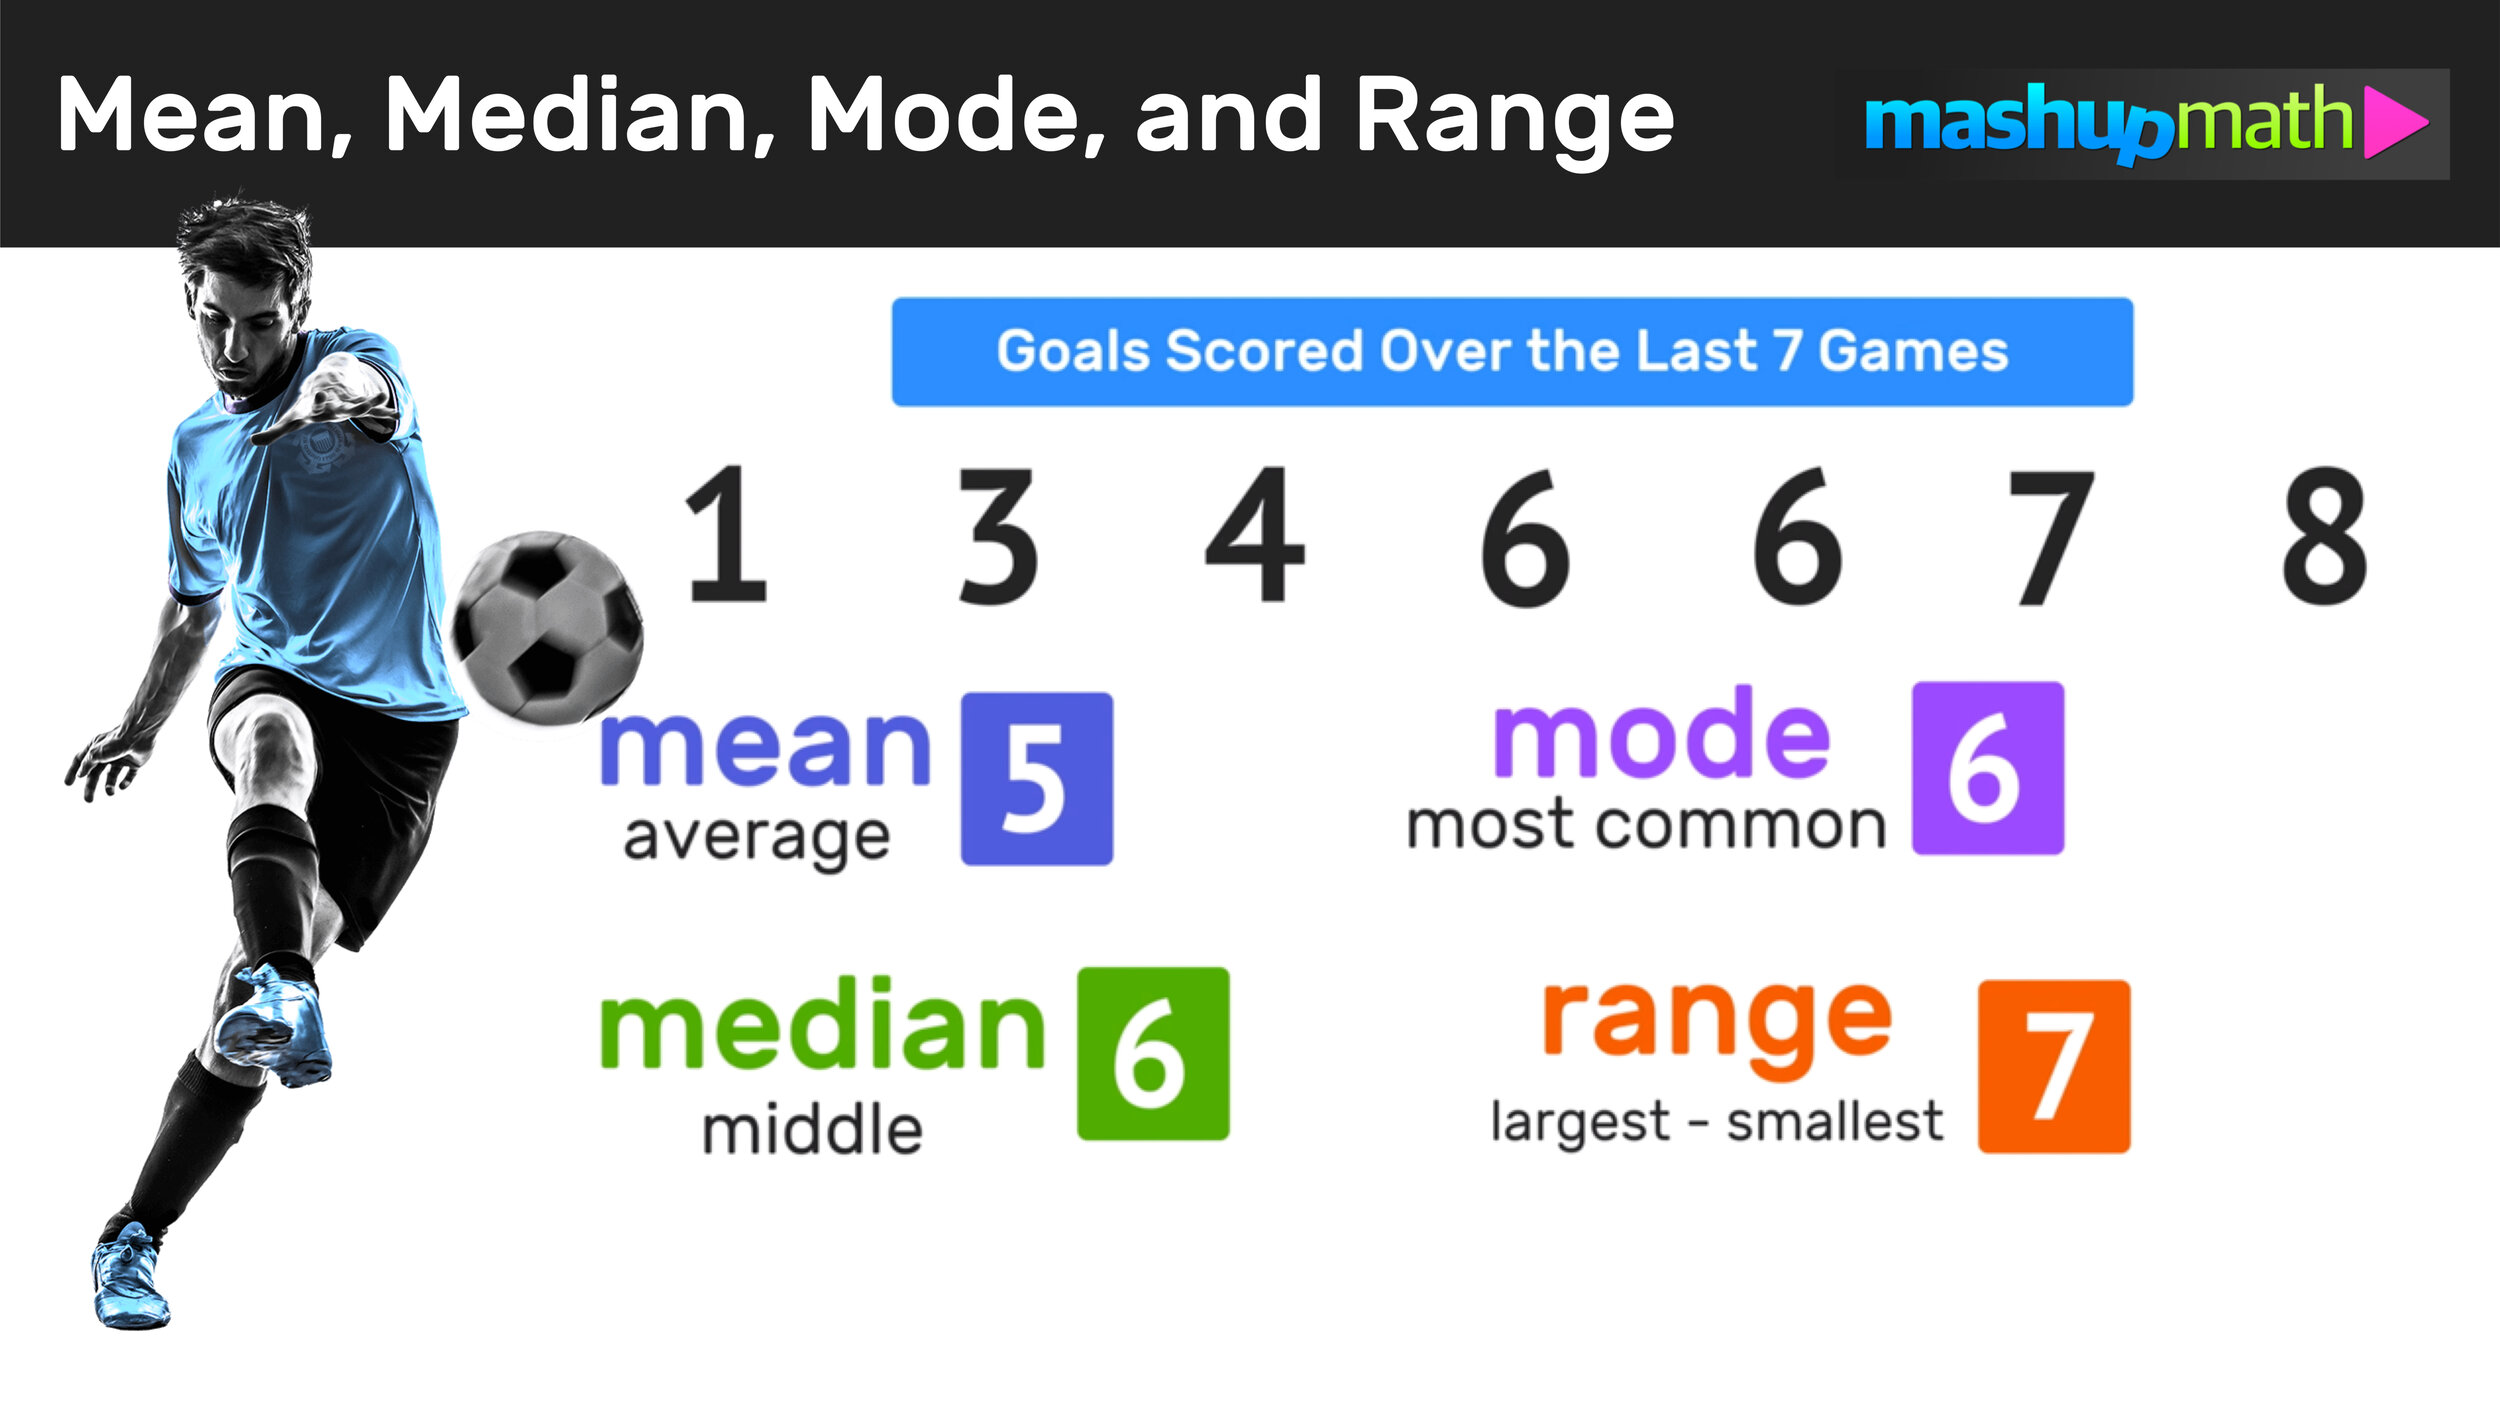
The mean, often simply called the “average,” is perhaps the most commonly used statistical measure. It’s calculated by summing all the values in a dataset and then dividing by the total number of values.
In finance, the mean helps us understand the central tendency of a dataset, such as average investment returns, average monthly expenses, or average customer transaction value. For instance, calculating the mean of your monthly utility bills over a year can give you a clear picture of your typical cost. While easy to compute and widely understood, the mean’s main drawback is its sensitivity to outliers—extremely high or low values that can significantly skew the average, potentially giving a misleading impression of the “typical” figure.
Median: The Middle Ground of Your Money Matters
The median is the middle value in a dataset when all values are arranged in ascending or descending order. If there’s an even number of values, the median is the average of the two middle numbers.
The median is particularly powerful in financial analysis because it’s less affected by outliers than the mean. Consider real estate prices: a few multi-million-dollar mansions can drastically inflate the mean home price in a neighborhood, but the median price will more accurately reflect what a typical buyer can expect to pay. Similarly, for understanding typical salaries or debt loads, the median often provides a more realistic representation, making it invaluable for personal financial benchmarking and business market analysis.
Mode: Identifying Financial Frequency
The mode is the value that appears most frequently in a dataset. A dataset can have one mode (unimodal), multiple modes (multimodal), or no mode if all values appear with the same frequency.
In a financial context, the mode helps identify common occurrences or popular choices. For a business, the mode might reveal the most frequently purchased product, indicating customer preference and guiding inventory decisions. For personal finance, you might find the mode of your spending categories to identify where most of your money typically goes, helping to target areas for saving. While useful for identifying common trends, the mode is less useful for continuous data where exact values rarely repeat and doesn’t tell us anything about the spread or average value of the data.
Range: Understanding Financial Volatility and Spread
The range is the simplest measure of dispersion, representing the difference between the highest and lowest values in a dataset. It tells you about the spread or variability of your data.
In finance, the range is crucial for understanding volatility and risk. For example, the range of a stock’s price over a year shows how much its value has fluctuated, giving an immediate sense of its riskiness. In personal budgeting, knowing the range of your variable expenses (like entertainment or dining out) can help you set realistic upper and lower limits for spending. While straightforward, the range can be overly influenced by a single extreme outlier and doesn’t provide information about the distribution of values between the minimum and maximum.
Applying Mean, Median, Mode, and Range in Personal Finance
For individuals, these statistical tools are not just theoretical; they are practical instruments for gaining control over one’s financial life.
Budgeting and Spending Habits
Effective budgeting starts with understanding where your money goes.
-
Mean: Calculate your mean monthly spending on categories like groceries, transportation, or utilities. This average helps you set realistic budget allocations and compare your spending to financial goals.
-
Median: If you have irregular expenses (e.g., a massive car repair bill one month), looking at your median monthly spending provides a more stable and representative figure of your “typical” outflow, helping you avoid over-budgeting based on an outlier.
-
Mode: Identifying the mode of your spending categories might reveal that “eating out” is your most frequent discretionary expense, signaling an area for potential savings or re-evaluation.
-
Range: Understanding the range of your variable expenses (e.g., entertainment, clothing) allows you to see the minimum you’ve spent and the maximum you’re capable of spending, aiding in emergency fund planning and discretionary spending limits.

Income Analysis and Goal Setting
These measures also help in evaluating your income and planning for the future.
-
Mean/Median Income: Whether assessing your own income progression or researching typical salaries for a new career, the mean and median provide crucial benchmarks. The median is often preferred for salary comparisons as it isn’t skewed by a few extremely high earners.
-
Goal Setting: By understanding your average income and expenses, you can set realistic savings goals and track your progress towards financial milestones like down payments, retirement, or debt repayment.
Leveraging Statistics for Investment Decisions
When it comes to investing, these statistical measures move beyond simple averages to become essential tools for evaluating performance, assessing risk, and making informed portfolio decisions.
Evaluating Investment Performance
Understanding how an investment has performed often involves looking beyond the surface.
-
Mean Return: The mean annual return of a stock or mutual fund gives you a quick snapshot of its average performance over a period. This is a common metric used by fund managers to advertise past performance.
-
Median Return: However, a few exceptionally good or bad years can significantly impact the mean. The median return offers a more stable measure of typical performance, especially useful for investments with highly variable returns, providing a clearer picture of what an investor might “typically” expect.
-
Range of Returns: The range of returns (highest return minus lowest return) is a direct indicator of an investment’s historical volatility. A wider range suggests higher risk, as the investment’s value has fluctuated more dramatically. Investors can use this to gauge comfort with potential ups and downs.
Risk Assessment and Portfolio Diversification
Statistics are vital for building a diversified portfolio that aligns with your risk tolerance.
-
Understanding Volatility: Comparing the range of returns for different assets helps investors understand their relative volatility. A stock with a small range of historical returns might be considered less risky than one with a very wide range.
-
Diversification Strategy: By analyzing the mean returns and ranges of various asset classes (stocks, bonds, real estate), investors can strategically diversify their portfolios. The goal is often to combine assets whose returns don’t move in perfect lockstep, thereby reducing the overall portfolio’s range of potential outcomes (i.e., its risk).
-
Mode for Investment Habits: While less common for continuous return data, the mode could be used in a qualitative sense to identify the most common investment strategies or investor behaviors in a given market, providing insights into crowd psychology.
Enhancing Business Finance with Data Insights
For businesses, these statistical measures are not just useful but essential for operational analysis, strategic planning, and maintaining profitability.
Sales and Revenue Analysis
Understanding sales data is fundamental to business success.
-
Mean/Median Sales: A business might calculate the mean or median sales per customer, per transaction, or per product unit. The median is particularly useful if there are a few very large or very small transactions that could skew the mean, giving a truer picture of a “typical” sale.
-
Mode for Product Popularity: The mode is invaluable for identifying the most popular products or services. This insight can drive inventory management, marketing campaigns, and product development efforts. If a certain product is consistently the mode of sales, it indicates strong demand.
-
Range for Sales Fluctuation: The range of daily or weekly sales figures can reveal the volatility of demand. A wide range might indicate seasonal fluctuations, promotional effectiveness, or external economic impacts, prompting businesses to adjust staffing, inventory, or marketing spend accordingly.
Cost Management and Profitability
Effective cost control is paramount for profitability.
-
Average Costs: Businesses use the mean to calculate average costs of goods sold (COGS), average operational expenses, or average labor costs. This helps in pricing strategies and setting budget targets.
-
Range of Expenses: Analyzing the range of a particular expense category (e.g., electricity bills, raw material costs) can highlight areas of high variability. Understanding this spread allows businesses to explore strategies for cost stabilization, such as hedging against volatile raw material prices or investing in energy-efficient systems.
-
Profit Margins: The mean or median profit margin provides a benchmark for business health, while the range of profit margins across different product lines or time periods can pinpoint where the business is most or least profitable.
Integrating Statistical Thinking for Smarter Financial Tools
Modern financial tools, from budgeting apps to sophisticated investment platforms, leverage these basic statistical measures to provide powerful insights and simplify complex data for users.
Financial Modeling and Forecasting
At the heart of financial planning and business strategy lies modeling and forecasting.
-
Predictive Analytics: Financial models often use historical mean, median, and range data to project future scenarios. For instance, a model might predict future stock prices based on their historical mean returns and volatility (range).
-
Sensitivity Analysis: By understanding the range of possible outcomes, businesses and individuals can conduct sensitivity analysis, exploring how different variables (e.g., changes in mean income, range of market returns) impact financial forecasts and long-term plans.
Data Visualization and Reporting
Financial dashboards and reports effectively communicate these statistical measures.
-
Clarity and Insight: Charts and graphs frequently use mean, median, mode, and range to visualize financial data clearly. A bar chart showing the mode of customer spending categories, a line graph depicting the mean monthly expense trend, or a box plot illustrating the median and range of investment returns—all make complex data digestible.
-
Empowering Decisions: By presenting these key statistics prominently, financial tools empower users to quickly grasp their financial situation, identify patterns, and make proactive decisions without needing to manually crunch numbers.
Conclusion
Mean, median, mode, and range are far more than abstract statistical terms; they are indispensable tools for anyone navigating the complexities of the financial world. From managing personal budgets and planning for retirement to making informed investment decisions and steering a business towards profitability, these measures provide crucial insights. They allow us to move beyond anecdotal evidence, giving us a data-driven foundation for understanding trends, assessing risks, and making smarter, more confident financial choices.
Embracing a basic understanding of these concepts empowers you to decode financial reports, critically evaluate investment advice, optimize your spending, and ultimately build a more secure and prosperous financial future. In the realm of money, knowledge truly is power, and these fundamental statistical measures are among your most potent allies.
aViewFromTheCave is a participant in the Amazon Services LLC Associates Program, an affiliate advertising program designed to provide a means for sites to earn advertising fees by advertising and linking to Amazon.com. Amazon, the Amazon logo, AmazonSupply, and the AmazonSupply logo are trademarks of Amazon.com, Inc. or its affiliates. As an Amazon Associate we earn affiliate commissions from qualifying purchases.