
In an increasingly data-centric world, understanding the fundamental building blocks of statistics is not just for mathematicians or academics; it’s a critical skill for anyone navigating or contributing to the digital landscape. At the heart of descriptive statistics lies the concept of the “mean,” a measure so common it often goes by its more colloquial name: the average. But when we talk about the “mean of a population,” we’re delving into a precise and powerful statistical concept with profound implications across technology, data science, and artificial intelligence.
This article will demystify the population mean, explain its calculation, explore its indispensable role in modern tech, and discuss the nuances involved in its application. From powering sophisticated machine learning algorithms to informing crucial software development decisions, the population mean is more than just a number; it’s a window into the characteristics of an entire group, offering insights that drive innovation and progress in the digital age.
The Foundation of Data Understanding in the Digital Age
At its core, the mean provides a single value that summarizes the central tendency of a dataset. When applied to a population, it represents the true average of every single observation within that complete group. This concept is foundational for anyone working with data, whether in scientific research, business analytics, or cutting-edge AI development.
Defining the Statistical Mean
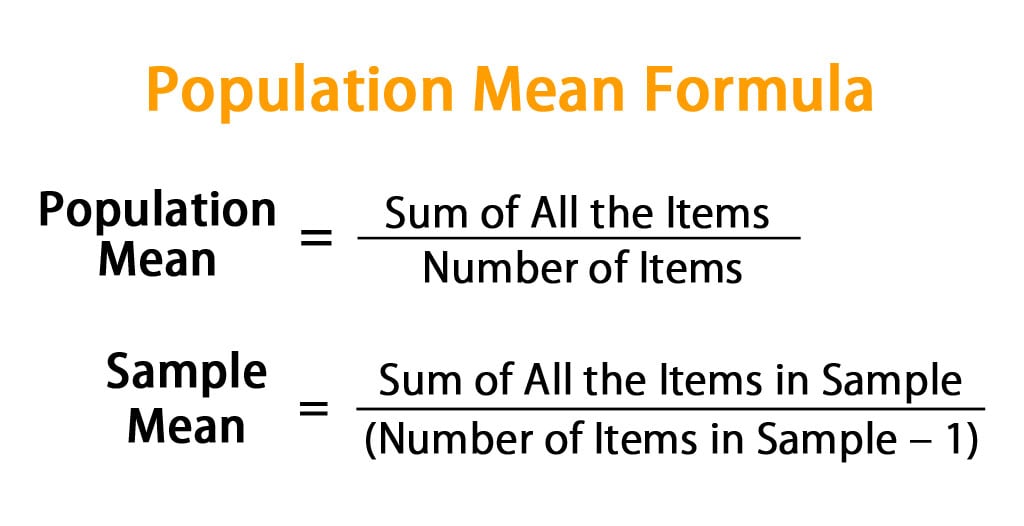
The statistical mean, specifically the arithmetic mean, is calculated by summing all the values in a dataset and then dividing by the number of values. It’s the most common measure of central tendency because it incorporates every value in the dataset, providing a balanced perspective. For a population, this calculation is exhaustive, considering every single element.
Imagine you’re developing an app and want to know the average age of all your potential users globally. If you could somehow gather the age of every single person on Earth, sum them up, and divide by the total human population, that would be the population mean age. While often practically impossible to measure directly for very large populations, the concept remains crucial for theoretical understanding and model building.
Population vs. Sample: A Crucial Distinction
A critical element in understanding the population mean is distinguishing between a “population” and a “sample.”
-
Population: In statistics, a population refers to the entire group of individuals, objects, or data points that you are interested in studying. It includes every single member that meets a defined characteristic. Examples could be all registered users of a specific software, all servers in a data center, or all lines of code in a particular codebase. The population mean is denoted by the Greek letter mu ($mu$).
-
Sample: A sample is a subset of the population. Because it’s often impractical or impossible to collect data from an entire population, researchers and data scientists typically work with samples. The mean calculated from a sample is called the sample mean, denoted by $bar{x}$ (x-bar), and is used as an estimate for the unknown population mean.
Understanding this distinction is vital. When we speak of the “mean of a population,” we are referring to the true average of the entire group, even if we can only ever estimate it through sampling in real-world scenarios. The accuracy of our tech solutions, from predictive models to system performance benchmarks, often depends on how well our sample mean approximates this true population mean.
Why the Mean Matters in a Data-Driven World
In an era saturated with data, the mean serves as a fundamental metric for making sense of vast datasets. For technology companies, it helps answer critical questions: What is the average uptime for all our cloud services? What is the mean response time for our API? What is the typical daily usage duration across our entire user base?
These insights guide product development, system optimization, user experience design, and strategic decision-making. Without a clear understanding of central tendencies, the sheer volume of raw data would be overwhelming and largely uninterpretable, hindering the ability to build effective software, intelligent systems, or user-friendly applications.
Calculating and Interpreting the Population Mean
While often estimated through samples, the conceptual understanding and theoretical calculation of the population mean are straightforward. However, its interpretation extends beyond merely stating a single number, requiring consideration of the context and the nature of the data.
The Formula Behind the Concept
The formula for the population mean ($mu$) is:
$mu = (sum X) / N$
Where:
-
$sum X$ (pronounced “sigma X”) represents the sum of all values in the population.
-
$N$ represents the total number of individuals or data points in the population.
For instance, if a small startup has 10 servers, and their daily CPU utilization percentages are: 70%, 75%, 60%, 80%, 65%, 72%, 78%, 68%, 71%, 73%.
The sum ($sum X$) would be 70+75+60+80+65+72+78+68+71+73 = 712.
The number of servers ($N$) is 10.
The population mean CPU utilization ($mu$) would be 712 / 10 = 71.2%.
This exact figure gives the true average utilization for all servers in this specific company’s server farm.
Practical Examples in Tech
The application of the population mean spans numerous tech domains:
-
Software Performance: Calculating the mean latency for all requests to a specific microservice.
-
User Behavior Analytics: Determining the average session duration for all users of a mobile app.
-
Hardware Reliability: Finding the mean time between failures (MTBF) for a batch of manufactured components.
-
Network Monitoring: Identifying the average bandwidth consumption across all devices on a corporate network.
-
AI Model Training: Computing the average pixel intensity across all images in an entire training dataset to normalize inputs.
In each case, understanding the population mean provides a benchmark or a central point of reference that is critical for evaluating performance, identifying trends, and making informed adjustments.
Beyond the Average: What the Mean Tells Us (and What it Doesn’t)
While powerful, the mean is just one piece of the puzzle. It tells us the central value but doesn’t convey information about the spread or variability of the data. For instance, two different populations could have the same mean, but one could have values tightly clustered around that mean, while the other could have values widely dispersed.
Consider two sets of software test scores, both with a mean of 75:
-
Set A: 74, 75, 76 (low variability)
-
Set B: 50, 75, 100 (high variability)
The mean alone would not reveal the significant difference in performance consistency. Therefore, the mean is most insightful when complemented by other statistical measures like standard deviation or variance, which quantify this spread.
The Mean’s Role in Modern Technology and AI
The population mean, whether estimated from a sample or theoretically understood, plays a pivotal role in the sophisticated algorithms and data processing techniques that power modern technology and artificial intelligence.
Fueling Machine Learning Algorithms

Many machine learning algorithms rely heavily on the concept of the mean for various purposes:
-
Data Preprocessing: Normalization and standardization techniques often subtract the mean (or sample mean) from data points to center the data, making it more amenable for algorithms. This is crucial for models like K-Nearest Neighbors, Support Vector Machines, and neural networks.
-
Feature Engineering: Creating new features by calculating means of related variables (e.g., average sensor reading over a time window).
-
Clustering Algorithms: K-Means clustering uses the mean to define the centroid of each cluster, iteratively assigning data points to the cluster whose mean is closest.
-
Regression Models: Linear regression seeks to model the relationship between variables, often with the mean of the dependent variable as a baseline for comparison.
-
Missing Value Imputation: Replacing missing data points with the mean of their respective features is a common imputation strategy.
Without the fundamental understanding and ability to calculate means, many of the advanced statistical and machine learning models that drive AI would struggle to function or perform optimally.
Data Analysis and Software Development
Beyond machine learning, the mean is a staple in general data analysis and software quality assurance:
-
A/B Testing: Comparing the mean performance (e.g., conversion rate, click-through rate) of two different versions of a software feature.
-
Performance Monitoring: Tracking the mean response time of services to detect degradation or improvement.
-
Bug Prioritization: Analyzing the mean time to resolution for different bug types to inform resource allocation.
-
Resource Allocation: Determining the average load on servers to dynamically scale infrastructure.
Software developers constantly use means to understand user behavior, optimize code, and ensure systems meet performance benchmarks. Tools embedded within IDEs or continuous integration pipelines often calculate and display mean metrics automatically.
Performance Metrics and Benchmarking
In the competitive tech landscape, benchmarking is essential. The mean serves as a primary metric for comparing the performance of different technologies, systems, or algorithms.
-
Algorithm Efficiency: Comparing the mean execution time of various sorting algorithms on the same dataset.
-
Hardware Capabilities: Benchmarking the average frames per second (FPS) of a graphics card across a suite of games.
-
Network Throughput: Measuring the mean data transfer rate of a new network protocol.
These benchmarks, often centered around mean performance, provide objective data points for evaluating new technologies, making purchasing decisions, and setting industry standards.
Challenges and Considerations When Working with Population Means
While powerful, relying solely on the mean can be misleading if not considered within the broader context of the data and its distribution. Understanding these challenges is crucial for robust data analysis in tech.
The Impact of Outliers
Outliers are extreme values that lie far away from other observations in a dataset. The mean is highly sensitive to outliers. A single exceptionally high or low value can significantly pull the mean in its direction, potentially misrepresenting the “typical” value of the population.
For example, if you’re analyzing the average salary of employees in a small tech startup, and the CEO earns significantly more than everyone else, including the CEO’s salary will inflate the mean, making it seem like employees earn more on average than they actually do. In such cases, the median (the middle value) might be a more robust measure of central tendency. In tech, identifying and handling outliers in sensor data, user behavior logs, or performance metrics is a critical step before calculating means for decision-making.
Data Skewness and Distribution
The mean works best for data that is symmetrically distributed, especially normally distributed data. However, many real-world tech datasets are skewed. For instance, website traffic might be heavily skewed towards a few viral posts, or user engagement might show a long tail of infrequent users.
-
Positive Skew (Right Skew): The tail of the distribution extends to the right, with most values clustered on the left. The mean will be greater than the median.
-
Negative Skew (Left Skew): The tail extends to the left, with most values clustered on the right. The mean will be less than the median.
When data is highly skewed, the mean might not accurately represent the typical value, as it will be pulled towards the longer tail. Data scientists often visualize data distributions (e.g., using histograms) to understand skewness before relying solely on the mean.
Ethical Implications in Data Interpretation
Misinterpreting or misrepresenting the mean can have ethical implications, particularly when data is used to inform policy, target specific user groups, or make claims about product performance. Presenting only the mean without acknowledging variability, outliers, or skewness can lead to:
-
Misleading Advertisements: “Our software reduces processing time by an average of X%!” without mentioning that this average is heavily influenced by a few specific, non-typical use cases.
-
Biased Decision-Making: Relying on an inflated mean user engagement to justify a product feature, overlooking that most users are not engaged at that level.
-
Unfair Comparisons: Benchmarking against competitors using means that are not robust to differences in data distribution or collection methods.
Responsible data analysis in tech requires transparency and a comprehensive understanding of statistical measures, including their limitations.
Leveraging Software and Tools for Mean Computation
Calculating the mean for small datasets by hand is feasible, but for the vast and complex datasets characteristic of the tech industry, specialized software and tools are indispensable. These tools not only compute the mean efficiently but also offer functionalities for handling outliers, visualizing distributions, and performing more advanced statistical analyses.
Statistical Programming Languages (Python, R)
For data scientists, machine learning engineers, and researchers, programming languages like Python and R are the go-to choices for statistical computation.
-
Python: Libraries such as NumPy (
numpy.mean()) and Pandas (dataframe.mean()) provide highly optimized functions for calculating means across arrays, columns, or entire datasets. These are fundamental for data preprocessing, exploratory data analysis, and integrating into machine learning pipelines. -
R: Built specifically for statistical computing and graphics, R offers direct functions like
mean()that are widely used for statistical analysis, data visualization, and model building.
These languages offer the flexibility and power to compute means on massive datasets, integrate these calculations into complex workflows, and perform sophisticated data transformations.
Spreadsheet Software and Data Analysis Platforms
For quick analysis, smaller datasets, or users who prefer a graphical interface, spreadsheet software and dedicated data analysis platforms are popular.
-
Microsoft Excel/Google Sheets: Both provide
AVERAGE()functions, making it simple to calculate means for specified ranges of data. They are excellent for initial data exploration and reporting. -
Tableau/Power BI: These business intelligence (BI) tools allow users to connect to various data sources, perform aggregations (including means), and create interactive dashboards for visualizing key performance indicators (KPIs) and trends. While primarily visualization tools, they leverage mean calculations extensively.
-
Jupyter Notebooks/Google Colab: These interactive computing environments allow for combining code (Python/R), text, and visualizations, making them ideal for data exploration, sharing analysis, and prototyping solutions where mean calculations are integral.
These tools democratize access to statistical insights, enabling a broader range of tech professionals, from project managers to marketing analysts, to understand and utilize the mean.

Real-time Analytics and Big Data Tools
In environments dealing with continuous streams of data or petabytes of historical information, specialized big data tools and real-time analytics platforms are essential.
-
Apache Spark: A unified analytics engine for large-scale data processing, Spark can compute means across distributed datasets with immense efficiency, making it suitable for big data analytics and machine learning on clusters.
-
Elasticsearch/Splunk: These platforms are designed for searching, analyzing, and visualizing large volumes of log data and operational intelligence. They can compute means on metrics like response times, error rates, and resource utilization in real time, providing immediate insights into system health and performance.
-
Cloud Data Warehouses (Snowflake, BigQuery, Redshift): These cloud-native solutions offer powerful SQL-based capabilities to perform aggregate functions, including mean calculations, on massive datasets without managing underlying infrastructure.
These advanced tools ensure that even the largest and most dynamic tech systems can continuously monitor, analyze, and leverage the mean to maintain performance, detect anomalies, and drive data-driven decision-making at scale.
In conclusion, the mean of a population is far more than a simple arithmetic average. It’s a foundational statistical concept that underpins much of how we understand, analyze, and interact with data in the digital age. From the theoretical bedrock of machine learning algorithms to the practical insights derived from software performance metrics, a nuanced understanding of the population mean is indispensable for anyone building, optimizing, or innovating within the vast and ever-evolving landscape of technology.
aViewFromTheCave is a participant in the Amazon Services LLC Associates Program, an affiliate advertising program designed to provide a means for sites to earn advertising fees by advertising and linking to Amazon.com. Amazon, the Amazon logo, AmazonSupply, and the AmazonSupply logo are trademarks of Amazon.com, Inc. or its affiliates. As an Amazon Associate we earn affiliate commissions from qualifying purchases.