
In the digital era, data is the lifeblood of decision-making. However, raw data in a spreadsheet is often incomprehensible to the human eye. This is where data visualization tools step in, transforming cold numbers into visual stories. Among the most fundamental of these tools is the bar graph. While the basic concept of a bar graph remains consistent, the technological implementation of these charts has evolved significantly. Understanding what bar graphs look like in a modern tech context involves exploring their structure, the software used to build them, and the user interface (UI) principles that make them effective.
The Digital Anatomy of a Bar Graph
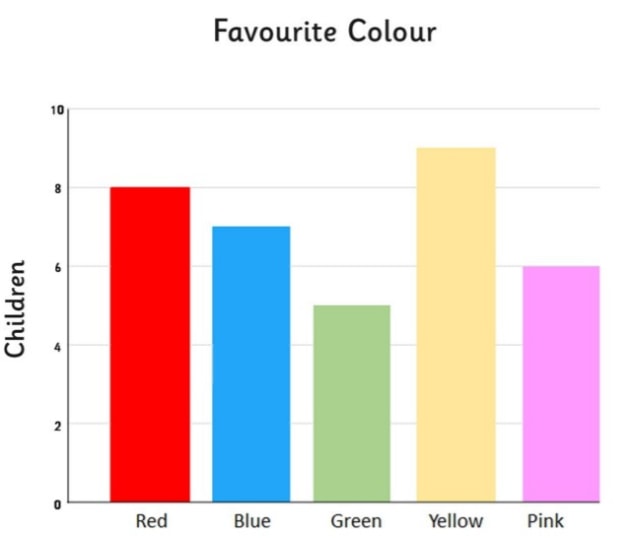
At its most basic level, a bar graph—or bar chart—is a graphical representation of data using rectangular bars with lengths proportional to the values they represent. In a technological environment, these are not just static drawings; they are dynamic objects rendered by code or sophisticated business intelligence (BI) software.
The Coordinate System and Axes
Modern software renders bar graphs on a two-dimensional plane defined by an X-axis (horizontal) and a Y-axis (vertical). In a standard vertical bar graph, the X-axis typically represents categorical variables (such as “Software Categories” or “Months”), while the Y-axis represents numerical values (such as “User Downloads” or “Latency in Milliseconds”).
The “look” of these axes in a tech context is often minimalist. Developers frequently use “grid lines”—faint horizontal or vertical lines—to help the eye trace the top of a bar back to the numerical value on the axis. In high-end UI design, these axes may be “hidden” to reduce visual clutter, appearing only when a user hovers their cursor over a specific data point.
Bar Orientation and Geometry
Bar graphs can be oriented vertically or horizontally. Vertical bar graphs are the standard for time-series data or comparisons where the category names are short. However, in software documentation or developer consoles, horizontal bar graphs are increasingly common. This is because horizontal bars allow for longer, more readable labels on the Y-axis, which is particularly useful when displaying complex technical metadata or long filenames.
The geometry of the bar itself has also evolved. While traditional charts used simple flat rectangles, modern UI frameworks like Material Design or Tailwind CSS often incorporate subtle gradients, rounded corners (border-radius), and drop shadows to give the bars a three-dimensional feel that matches the overall application theme.
Color Systems and Data Encoding
In technology, color is rarely just aesthetic; it is functional. A bar graph in a server monitoring tool might use color to encode status: green bars for healthy performance, yellow for warnings, and red for critical failures. What a bar graph “looks like” is therefore defined by its color palette, which must often comply with accessibility standards such as the Web Content Accessibility Guidelines (WCAG) to ensure that color-blind users can still interpret the data.
Software Engines: How Tech Generates Bar Graphs
Generating a bar graph today involves a variety of software stacks, ranging from low-level coding libraries to high-level “no-code” platforms. The look of the graph often reveals the tool used to create it.
JavaScript Libraries and Web Rendering
For web applications, bar graphs are typically rendered using JavaScript libraries.
-
D3.js (Data-Driven Documents): This is the gold standard for custom visualizations. Bar graphs made with D3.js look highly bespoke and are often capable of complex animations.
-
Chart.js and Recharts: These libraries produce “clean” and responsive bar graphs that are common in SaaS dashboards. They look polished and provide built-in responsiveness, meaning the bars resize themselves automatically when viewed on a mobile device versus a desktop monitor.
-
Canvas vs. SVG: Technologically, bar graphs are rendered as either Scalable Vector Graphics (SVG) or HTML5 Canvas elements. SVGs look crisp at any zoom level because they are math-based, whereas Canvas-based graphs are better for rendering thousands of bars simultaneously without slowing down the browser.
Business Intelligence (BI) and Analytics Platforms
Tools like Microsoft Power BI, Tableau, and Google Looker Studio have a distinct aesthetic. These bar graphs often look “enterprise-grade.” They include complex features such as “drill-down” capabilities, where clicking a bar transforms the graph to show a more detailed subset of that data. The visual style here is focused on density—fitting as much information as possible into a single view through the use of tooltips, legends, and sidebars.
Python for Data Science and AI
In the realms of Artificial Intelligence and Machine Learning, bar graphs are often generated using Python libraries like Matplotlib or Seaborn. These graphs have a “scientific” look—they are often more academic in their presentation, prioritizing precise labeling, statistical notations, and high-resolution export formats for technical whitepapers. In this context, a bar graph might include “error bars”—thin lines extending from the top of the bar to show the standard deviation or margin of error in an AI model’s prediction.
Interactive Elements: The Tech-Enhanced Experience
Unlike a bar graph on a printed page, a digital bar graph is an interactive interface. The “look” of the graph changes based on user behavior, which is a hallmark of modern software design.
Hover Effects and Tooltips
When a user moves their mouse over a bar, software typically triggers a “hover state.” The bar might brighten, change color, or grow slightly in size. Simultaneously, a “tooltip” appears—a small floating box that provides the exact numerical value and additional context. This allows the graph to remain visually clean while still providing deep granular data on demand.
Dynamic Filtering and Transitions
In a modern tech dashboard, bar graphs are rarely static. They are often connected to APIs (Application Programming Interfaces) that feed them real-time data. When a user changes a date range or filters for a specific software version, the bars don’t just “snap” to new positions; they animate. They might slide from the bottom up or transition smoothly from one height to another. This animation is not just for show; it helps the user visually track how the data is changing, maintaining a sense of continuity.
Stacked and Grouped Configurations
When dealing with complex data sets, a single bar isn’t enough.
-
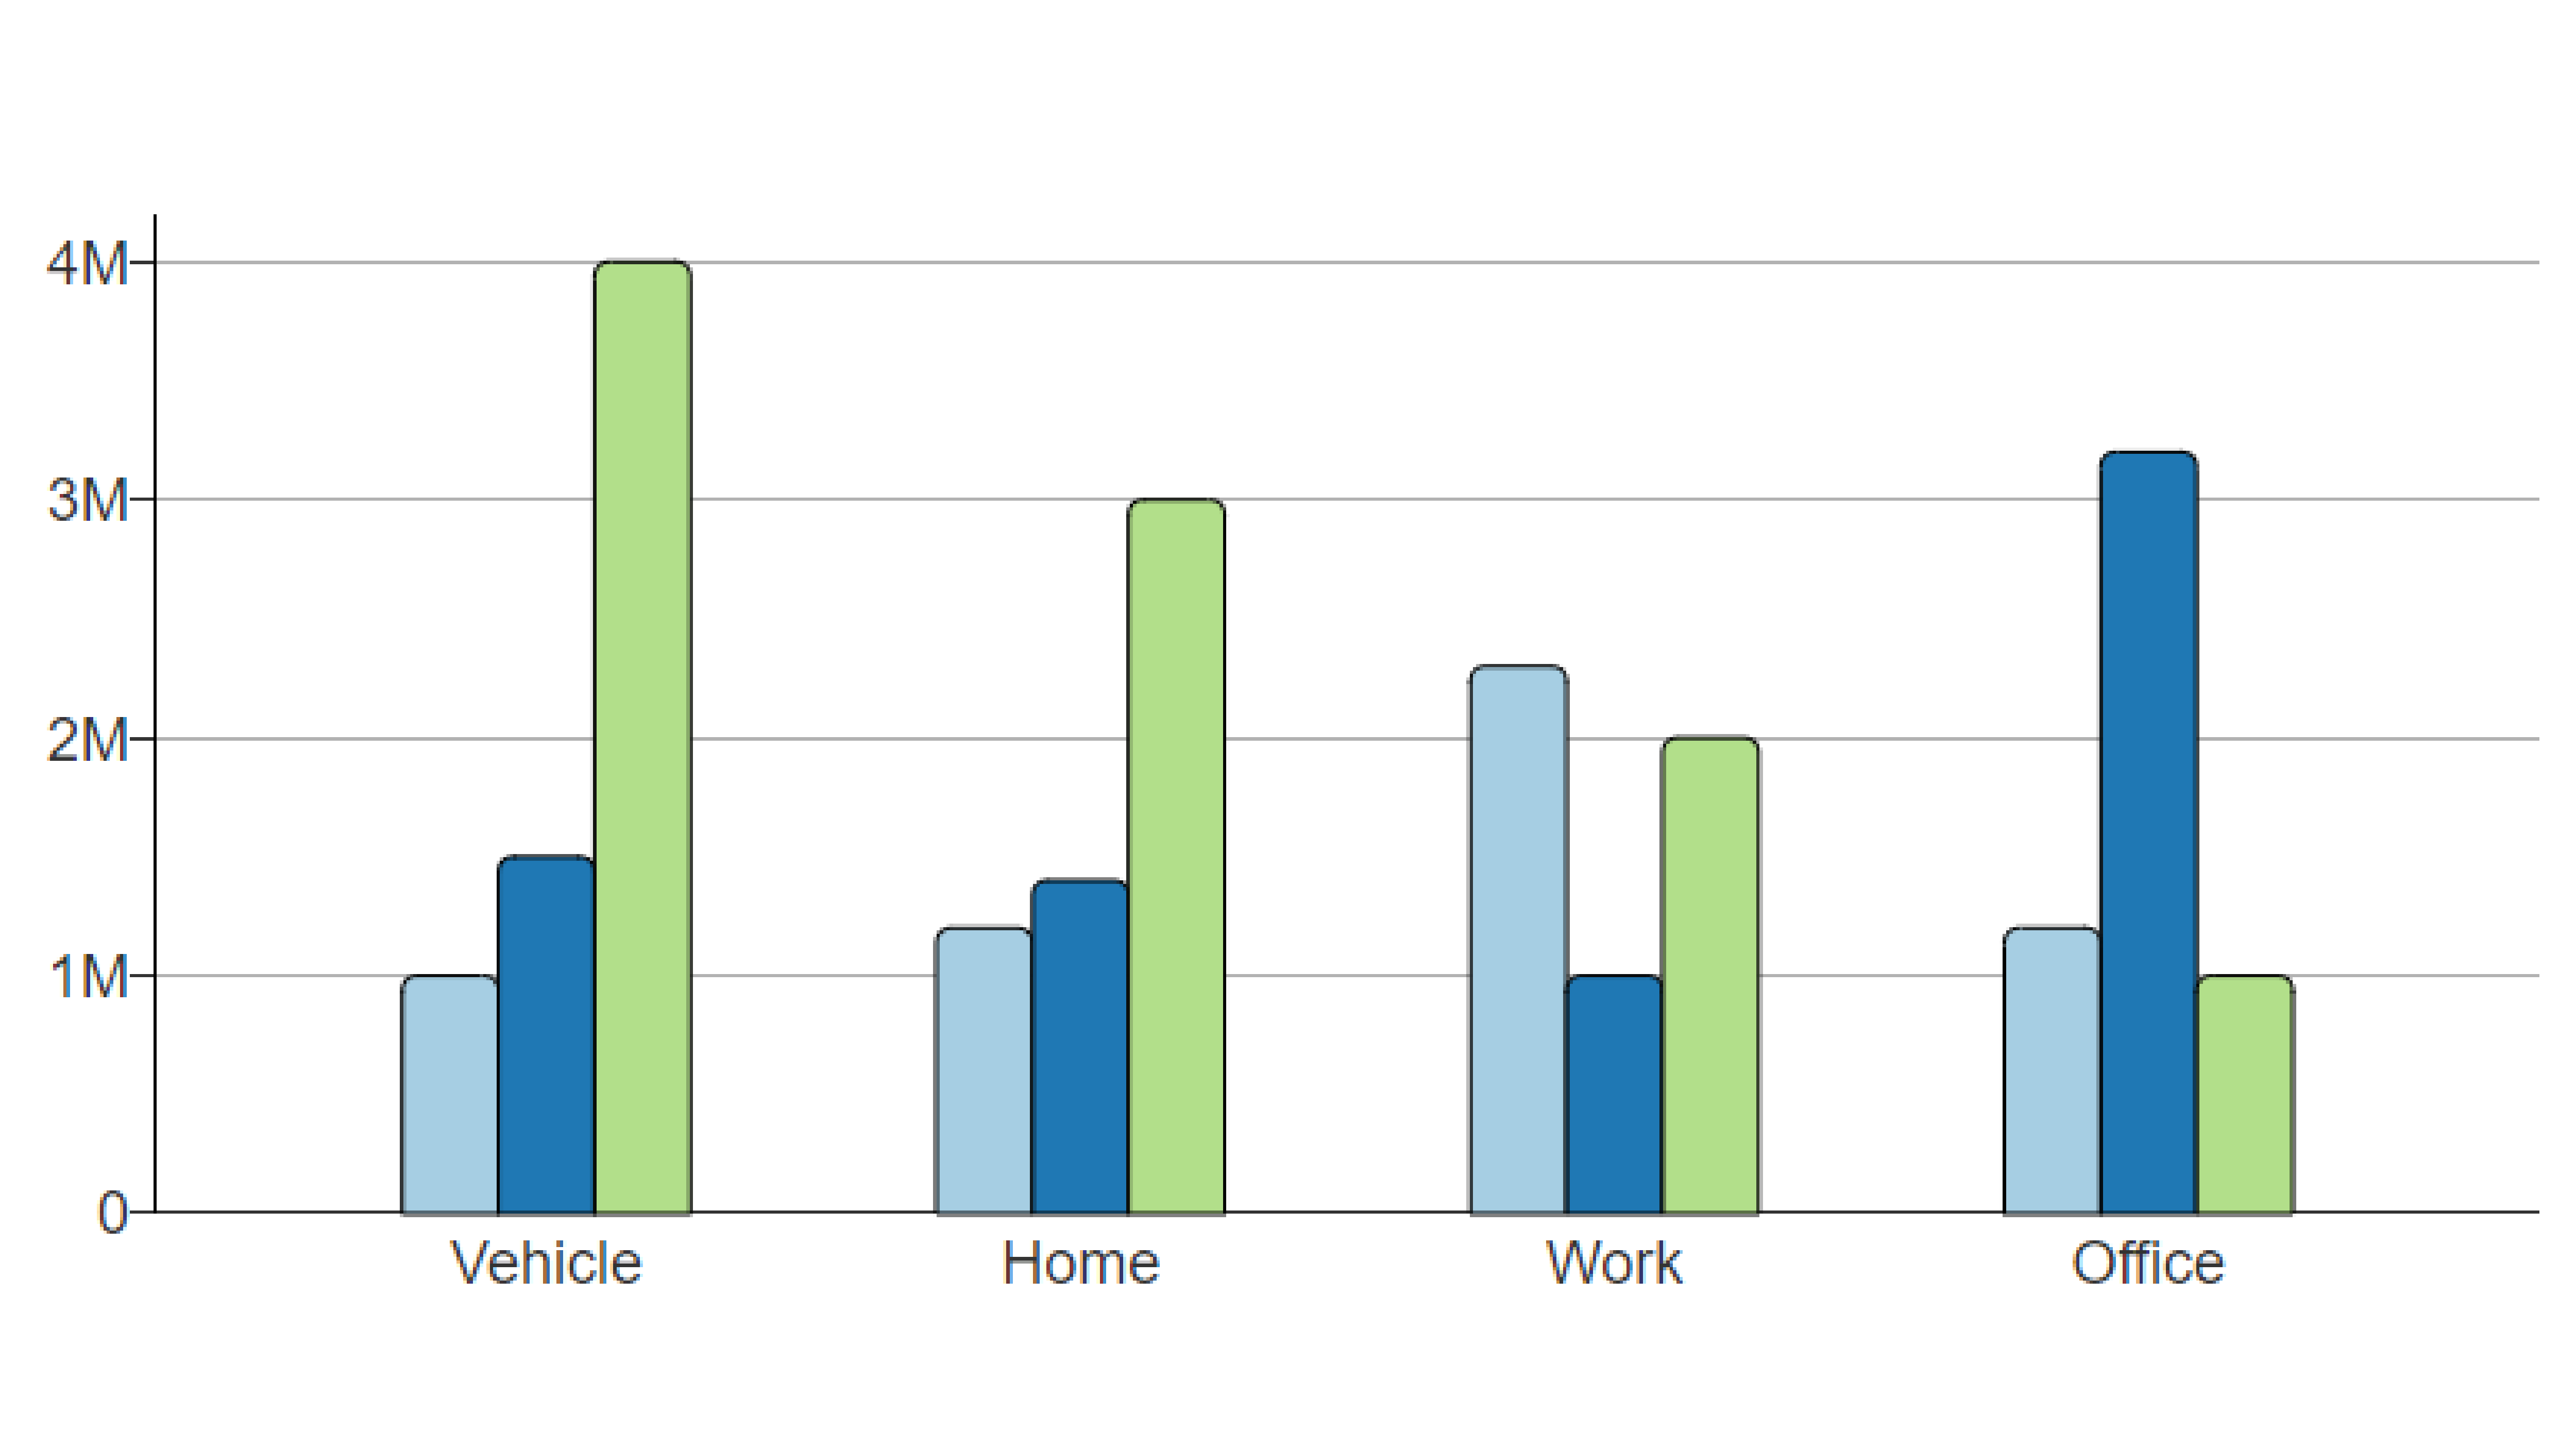
Stacked Bar Graphs: These look like single bars divided into different colored segments. This is used in tech to show, for example, total cloud storage usage, with segments representing “Images,” “Videos,” and “Documents.”
-
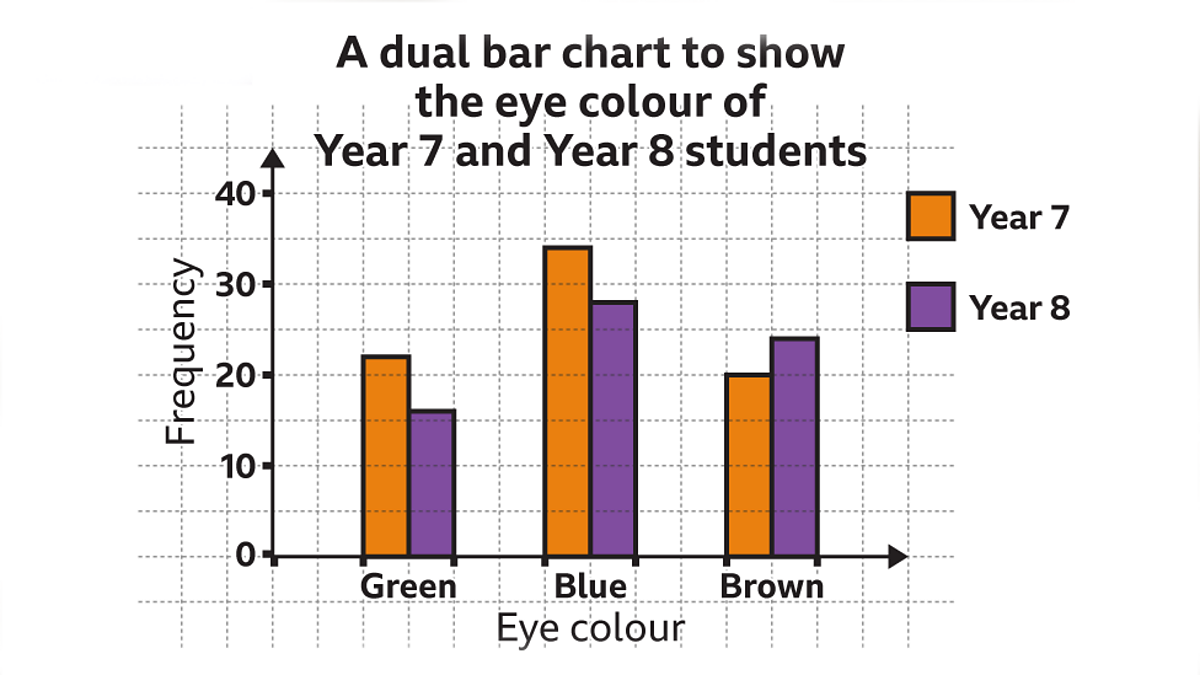
Grouped Bar Graphs: These feature clusters of bars side-by-side. You might see this in a tech review comparing the performance of three different CPUs across five different software benchmarks. Each “group” on the X-axis would contain three distinct bars, one for each CPU.
UX/UI Considerations for Digital Bar Graphs
The design of a bar graph is a critical part of the User Experience (UX). Tech companies spend millions of dollars optimizing how data is presented to ensure users can make fast, accurate decisions.
Responsiveness and Aspect Ratios
A significant challenge in tech is making a bar graph look good on both a 30-inch monitor and a 5-inch smartphone screen. Modern graphs use “responsive design,” which might involve switching from a vertical bar graph on a desktop to a horizontal bar graph on a mobile device to better fit the vertical scroll of a phone.
Data Density and “Chartjunk”
In software circles, there is a strong movement toward “minimalism,” influenced by data visualization pioneers like Edward Tufte. This means removing “chartjunk”—unnecessary 3D effects, heavy borders, and distracting backgrounds. A modern, high-tech bar graph looks “flat.” It uses whitespace effectively to ensure that the bars themselves are the focal point. This clarity is essential in high-stakes environments, such as a cybersecurity dashboard where an analyst needs to identify a traffic spike in seconds.
Dark Mode Integration
With the rise of “Dark Mode” across operating systems and IDEs (Integrated Development Environments), bar graphs must now be designed with dual color schemes. A bar graph in a developer tool must look just as legible with a charcoal background and neon-colored bars as it does with a white background and pastel-colored bars. This requires the use of CSS variables and design tokens that allow the graph’s appearance to flip instantly based on the user’s system settings.
The Future: AI-Generated and AR Bar Graphs
As we look toward the future of technology, the way bar graphs look is set to change even more radically.
Natural Language to Visualization
Generative AI is changing how graphs are created. Instead of manually building a chart, users can type, “Show me a bar graph of our API uptime for the last 30 days.” The AI then selects the best visual parameters, colors, and scales to represent that data. This means bar graphs are becoming more personalized, generated on the fly to answer specific technical questions.
Augmented Reality (AR) and 3D Spaces
In the world of spatial computing (like the Apple Vision Pro or Meta Quest), bar graphs are stepping off the screen. In an AR environment, a bar graph might look like a 3D hologram sitting on a desk. Users can walk around the data, seeing the heights of the bars from different angles. While 3D bar graphs are usually discouraged on 2D screens due to perspective distortion, in a true 3D spatial environment, they offer a brand-new way to “feel” the scale of data.
Conclusion
What a bar graph looks like in the modern tech landscape is far more complex than a few rectangles on a page. It is a sophisticated blend of data science, software engineering, and UI/UX design. From the minimalist, responsive charts found in SaaS platforms to the high-performance, interactive visualizations in developer tools, the bar graph remains the most effective way to turn digital noise into actionable insight. As technology continues to evolve, these graphs will become even more interactive, personalized, and integrated into our digital environments, ensuring that no matter how much data we generate, we will always be able to see what it means.
aViewFromTheCave is a participant in the Amazon Services LLC Associates Program, an affiliate advertising program designed to provide a means for sites to earn advertising fees by advertising and linking to Amazon.com. Amazon, the Amazon logo, AmazonSupply, and the AmazonSupply logo are trademarks of Amazon.com, Inc. or its affiliates. As an Amazon Associate we earn affiliate commissions from qualifying purchases.