
In the intricate world of personal finance, investing, and business strategy, few concepts are as pervasive, powerful, and potentially perplexing as percentages. Far more than mere mathematical symbols, percentages serve as the universal language through which we quantify risk, measure return, allocate resources, and evaluate performance. From the interest rate on your mortgage to the profit margin of a Fortune 500 company, understanding “what are the percentages” is not just about arithmetic; it’s about unlocking the insights needed to make informed, strategic financial decisions that drive growth, mitigate risk, and build wealth.
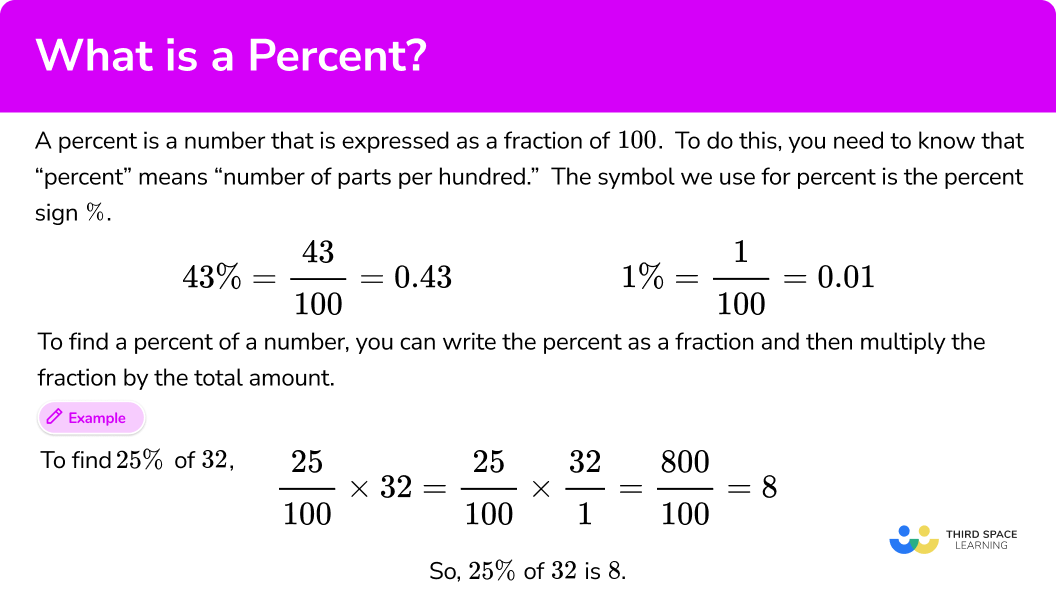
This article delves into the multifaceted role of percentages across the financial spectrum, demystifying their application in personal finance, investments, and business operations. We will explore how these seemingly simple figures shape our financial reality, offering practical insights into leveraging them for better financial health and strategic advantage.
The Indispensable Role of Percentages in Personal Finance
Personal finance is the bedrock of individual economic well-being, and percentages are its foundational building blocks. They allow us to translate complex financial data into digestible, comparable metrics, empowering individuals to manage their money effectively.
Budgeting and Spending: Allocating Your Income
One of the most immediate applications of percentages in personal finance is budgeting. Without a clear understanding of how your income is divided, financial stability remains elusive. The classic 50/30/20 rule, for instance, is a percentage-based framework that simplifies budget planning:
-
50% for Needs: This covers essential expenses like housing, utilities, groceries, transportation, and debt minimums. Understanding this percentage helps ensure basic survival and financial stability. If this percentage is too high, it signals a need to reduce core expenses or increase income.
-
30% for Wants: Discretionary spending, such as dining out, entertainment, hobbies, and vacations, falls into this category. Managing this percentage is crucial for enjoying life without derailing long-term financial goals.
-
20% for Savings and Debt Repayment: This critical percentage is dedicated to building an emergency fund, saving for retirement, contributing to investment accounts, and aggressively paying down high-interest debt. Consistently meeting or exceeding this percentage is a hallmark of strong financial health.
Beyond rules of thumb, tracking your actual spending as a percentage of your income reveals where your money truly goes. Are you spending 15% on dining out when you aimed for 10%? Are only 5% of your earnings going into savings? These percentage insights are invaluable for adjusting habits and aligning spending with financial goals.
Debt Management: Understanding Interest and Repayment
Debt, for many, is an unavoidable part of modern life, but managing it effectively hinges on understanding percentages.
-
Interest Rates: The interest rate, expressed as a percentage, is arguably the most critical figure associated with debt. A 5% mortgage rate versus a 20% credit card APR highlights the stark difference in the cost of borrowing. High interest percentages can exponentially increase the total amount paid over the life of a loan, trapping individuals in a cycle of debt.
-
Debt-to-Income (DTI) Ratio: Lenders frequently assess a borrower’s creditworthiness using the DTI ratio, which compares monthly debt payments to gross monthly income. A common benchmark for an acceptable DTI is often below 36%, with anything above 43% generally considered high risk. Understanding your DTI percentage is vital for evaluating your capacity to take on new debt and for improving your financial standing.
-
Loan-to-Value (LTV) Ratio: In real estate, the LTV ratio (loan amount divided by property value) determines how much equity a homeowner has and impacts mortgage terms. A lower LTV percentage (e.g., 80% or less) typically results in more favorable interest rates and avoids private mortgage insurance (PMI).
By meticulously tracking these percentages, individuals can strategically prioritize debt repayment, aiming to eliminate high-interest obligations first, thereby reducing the percentage of their income consumed by interest payments.
Unlocking Investment Potential: Percentage-Based Returns and Risks
In the realm of investments, percentages transition from merely describing current financial states to forecasting potential growth, measuring performance, and quantifying risk. They are the language of capital appreciation and depreciation.
Measuring Investment Performance: Return on Investment (ROI)
The most fundamental percentage in investing is the Return on Investment (ROI). Whether you’re assessing a stock, a mutual fund, or a real estate venture, ROI quantifies the gain or loss generated relative to the initial investment.
-
Simple ROI: Calculated as
(Current Value - Original Cost) / Original Cost * 100%, simple ROI provides a straightforward measure of profitability. For example, if you invested $1,000 and it grew to $1,200, your ROI is 20%. -
Annualized Return: For investments held over multiple periods, annualized return provides a standardized way to compare performance across different timeframes. This is crucial because a 10% return over six months is vastly different from a 10% return over five years. Annualized percentages allow for “apples-to-apples” comparisons.
-
Compound Annual Growth Rate (CAGR): CAGR measures the average annual growth rate of an investment over a specified period longer than one year, assuming the profits are reinvested. It smooths out volatile returns, providing a more accurate picture of sustained growth. Understanding CAGR is vital for appreciating the power of compounding, where your earnings themselves earn returns, leading to exponential growth over time.
Assessing Risk and Volatility
Percentages also play a critical role in quantifying investment risk.
-
Standard Deviation: In statistics, standard deviation measures the dispersion of a set of data from its mean. In finance, it’s used to quantify the historical volatility or risk of an investment. A higher percentage standard deviation indicates greater price fluctuations and thus higher risk.
-
Beta: Beta measures an investment’s volatility in relation to the overall market. A beta of 1 means the asset’s price moves with the market. A beta greater than 1 suggests higher volatility (e.g., a stock with a beta of 1.5 would theoretically move 1.5% for every 1% market move), while a beta less than 1 suggests lower volatility. Investors use beta percentages to gauge how much risk an asset adds to a diversified portfolio.
-
Allocation Percentages: Portfolio diversification, a cornerstone of risk management, is inherently percentage-based. An investor might allocate 60% of their portfolio to stocks, 30% to bonds, and 10% to alternative investments. These percentages are continuously monitored and rebalanced to maintain the desired risk profile and optimize potential returns.
Understanding these risk-related percentages allows investors to construct portfolios aligned with their risk tolerance and financial objectives, balancing the pursuit of high returns with the imperative of capital preservation.
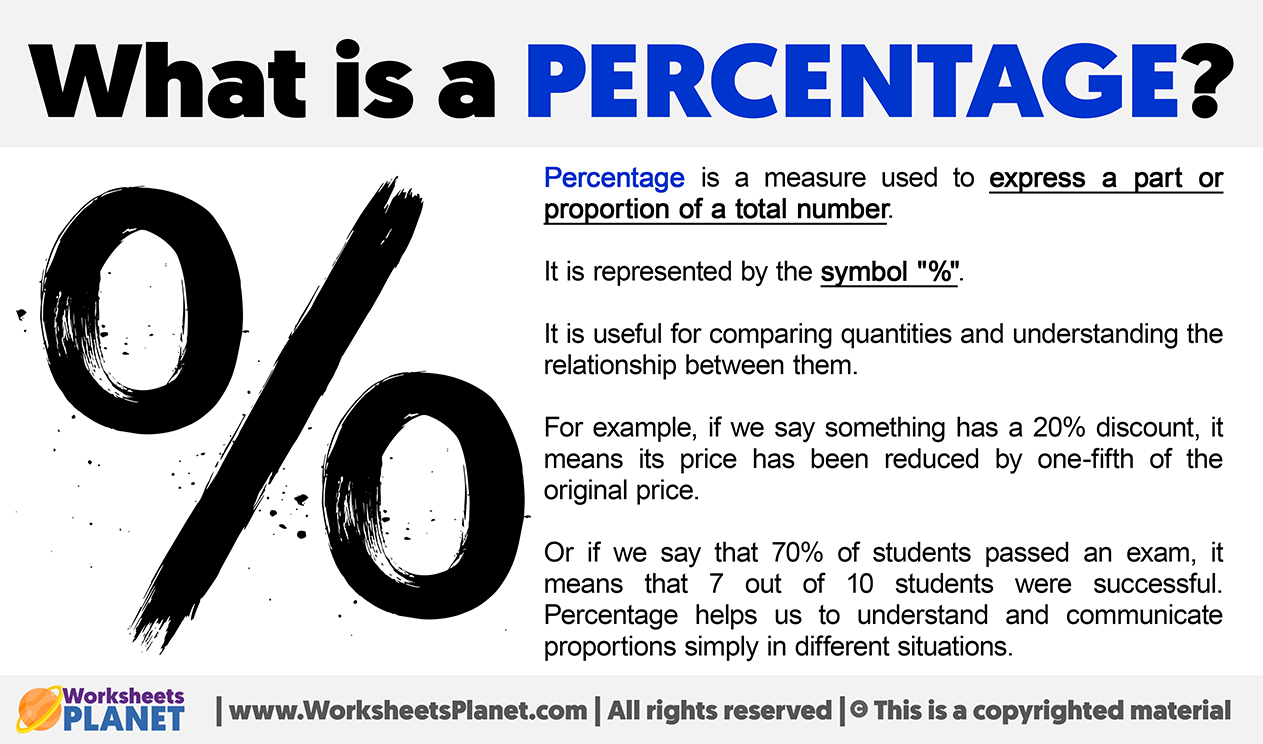
Business Finance: Navigating Growth with Percentage Metrics
For businesses, percentages are not just metrics; they are vital diagnostic tools, performance indicators, and strategic guides. They translate raw financial data into actionable intelligence, influencing everything from pricing strategies to expansion plans.
Profitability and Efficiency Ratios
Businesses rely heavily on various percentage-based ratios to gauge their profitability and operational efficiency.
-
Gross Profit Margin: Calculated as
(Revenue - Cost of Goods Sold) / Revenue * 100%, this percentage indicates the profitability of a company’s core operations before overhead expenses. A healthy gross profit margin is crucial for covering operating costs and generating net profit. -
Net Profit Margin:
(Net Income / Revenue) * 100%shows the percentage of revenue left after all expenses, including taxes and interest, have been deducted. It’s a key indicator of a company’s overall efficiency and profitability. Businesses constantly strive to improve this percentage. -
Operating Expense Ratio: This ratio compares operating expenses to revenue, highlighting how efficiently a company manages its overhead. A rising percentage here can signal inefficiencies or uncontrolled spending.
-
Return on Assets (ROA) and Return on Equity (ROE): ROA measures how efficiently a company uses its assets to generate earnings, while ROE shows how much profit a company generates for each dollar of shareholder equity. These percentages are critical for investors evaluating management effectiveness and for internal management to optimize asset utilization.
By meticulously tracking these and other profitability percentages, businesses can identify areas for improvement, adjust pricing, control costs, and ultimately enhance their financial performance.
Growth and Market Share
Percentages also define a company’s standing within its industry and its trajectory for growth.
-
Revenue Growth Rate: Expressed as a percentage, this measures the increase in a company’s revenue over a specific period. Consistent positive growth percentages are indicative of a healthy and expanding business.
-
Market Share: This percentage represents a company’s sales as a proportion of the total sales for its industry. Gaining market share (increasing this percentage) is often a primary strategic objective, signaling competitive strength and potential for future growth.
-
Customer Retention Rate: The percentage of customers a business retains over a given period is a crucial indicator of customer satisfaction and loyalty. A high retention rate often translates to lower marketing costs and increased lifetime customer value.
Understanding these growth and market percentages helps businesses benchmark their performance against competitors, set strategic targets, and allocate resources effectively to capture opportunities and sustain expansion.
Leveraging Percentages for Informed Financial Decision-Making
The power of percentages lies not just in their ability to describe financial realities, but in their capacity to empower better decision-making. Whether you’re an individual planning for retirement or a CEO strategizing market entry, percentages provide the analytical framework.
The Power of Compounding Percentages
One of the most profound concepts in finance is the power of compounding interest, which is inherently percentage-driven. Earning a return on your initial investment and on the accumulated interest means your money grows exponentially over time. Understanding this principle, often framed as the “Rule of 72” (divide 72 by the annual interest rate to estimate how long it takes for an investment to double), highlights the long-term impact of even small percentage differences in investment returns. A difference of just 1-2 percentage points in annual return can translate into hundreds of thousands, or even millions, of dollars over decades.
Analyzing Economic Indicators
Beyond individual and business finance, percentages are the language of macroeconomics. Inflation rates, unemployment rates, GDP growth rates, and interest rate changes (often expressed in percentage points or basis points) are all critical economic indicators that influence investment strategies, business planning, and personal financial decisions. A rising inflation percentage, for example, erodes purchasing power, prompting individuals to seek higher-yielding investments and businesses to adjust pricing.
Avoiding Percentage Pitfalls
While percentages are invaluable, it’s crucial to interpret them correctly and avoid common pitfalls. Misleading percentage comparisons (e.g., comparing absolute percentage points vs. percentage change), ignoring the base number from which a percentage is derived, or failing to account for inflation when calculating real returns can lead to flawed conclusions. Context is paramount; a 100% growth rate from a $1,000 base is very different from a 1% growth rate from a $1 billion base.
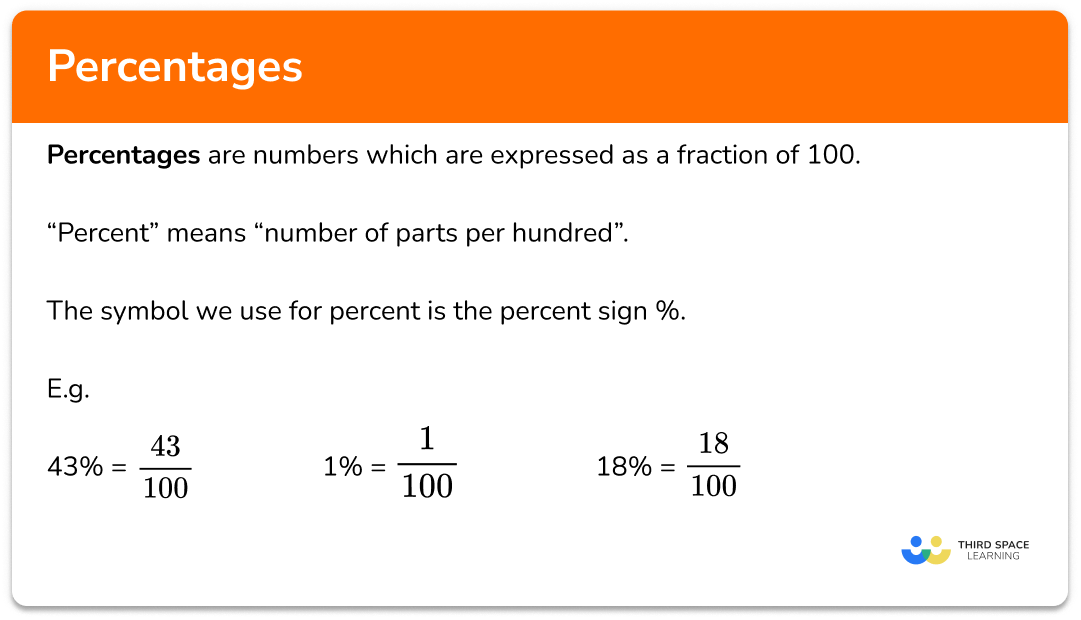
Conclusion
“What are the percentages?” is a deceptively simple question that unlocks a universe of financial understanding. From the granular details of a personal budget to the sweeping metrics of global economies, percentages are the indispensable tools that quantify, compare, and clarify. They empower individuals to manage their money, investors to grow their wealth, and businesses to achieve profitability and sustainable growth. By developing a keen understanding of these financial percentages, their implications, and their strategic applications, anyone can transform complex financial data into actionable insights, paving the way for more informed decisions and a more secure, prosperous financial future.
aViewFromTheCave is a participant in the Amazon Services LLC Associates Program, an affiliate advertising program designed to provide a means for sites to earn advertising fees by advertising and linking to Amazon.com. Amazon, the Amazon logo, AmazonSupply, and the AmazonSupply logo are trademarks of Amazon.com, Inc. or its affiliates. As an Amazon Associate we earn affiliate commissions from qualifying purchases.