
In the dynamic world of personal finance, investing, and business operations, understanding change is paramount. Whether you’re tracking the growth of your investment portfolio, analyzing the impact of a budget adjustment, or evaluating a company’s revenue performance, the ability to quantify these shifts is crucial. While raw numbers show us the magnitude of change, percentages provide context, allowing for meaningful comparisons and deeper insights into financial performance over time. This foundational skill empowers individuals and businesses to make informed decisions, identify trends, and strategize for future financial success.
The Foundation of Financial Analysis: Understanding Percentage Change
At its core, financial analysis is about making sense of numbers, and few metrics offer as much clarity as percentage change. It transforms absolute numerical shifts into a relative measure, making data comparable across different scales and timeframes. Without this tool, evaluating financial health or performance would be akin to navigating a dense fog – you might know you’re moving, but not how fast or in what direction relative to your goals.
Why Percentage Change Matters in Finance
The relevance of percentage change in the financial realm cannot be overstated. For an individual, it’s the key to understanding:
-
Investment Performance: How much has your stock or mutual fund grown (or shrunk) over a period? A $100 gain on a $1,000 investment is a 10% increase, while a $100 gain on a $10,000 investment is only 1%. The percentage tells the real story of efficiency.
-
Budgeting and Spending Habits: Has your grocery bill increased or decreased this month compared to last? A 5% increase might warrant attention, helping you adjust future spending.
-
Debt Reduction Progress: What percentage of your credit card debt have you paid off? This provides a motivational benchmark and a clear picture of progress.
-
Income Growth: Are you truly getting ahead financially? A 3% raise might sound good, but if inflation is 5%, your real purchasing power has decreased.
For businesses, percentage change is integral to:
-
Revenue and Profitability Analysis: Tracking quarter-over-quarter or year-over-year growth to gauge business health and market penetration.
-
Cost Management: Identifying areas where expenses have increased disproportionately, signaling potential inefficiencies or challenges.
-
Market Share Evolution: Understanding how a company’s position within its industry is shifting.
-
Performance Metrics (KPIs): Many Key Performance Indicators (KPIs) are expressed as percentages, such as profit margins, conversion rates, or customer retention rates, whose changes are crucial for strategic adjustments.
Differentiating Absolute vs. Relative Change
Before diving into calculations, it’s important to distinguish between absolute and relative change.
-
Absolute Change is the raw numerical difference between a new value and an old value. It’s simply
New Value - Old Value. For example, if your investment grew from $1,000 to $1,100, the absolute change is $100. -
Relative Change (or percentage change) expresses this absolute difference as a proportion of the original value, multiplied by 100 to convert it into a percentage. It provides context and allows for comparison. Using the same example, a $100 increase on $1,000 is a 10% relative increase.
While absolute change tells you how much, relative change tells you how significant that change is. In finance, significance is often more valuable than raw numbers.
Calculating Percentage Increase: Growing Your Wealth
When we talk about financial growth – be it in investments, income, or business revenue – we are often referring to a percentage increase. This calculation helps quantify positive shifts and understand the rate at which value is being added.
The Basic Formula for Percentage Increase
The formula for percentage increase is straightforward:
Percentage Increase = [(New Value - Old Value) / Old Value] * 100
Let’s break it down:
-
Find the Difference: Subtract the old value from the new value (
New Value - Old Value). This gives you the absolute increase. -
Divide by the Original: Divide that absolute increase by the original (old) value. This expresses the increase as a decimal proportion.
-
Multiply by 100: Multiply the result by 100 to convert the decimal into a percentage.
Example: Your investment portfolio grew from $50,000 to $57,500.
Increase = (57,500 - 50,000) = 7,500
Percentage Increase = (7,500 / 50,000) * 100 = 0.15 * 100 = 15%
Your portfolio increased by 15%.
Real-World Applications in Personal Finance (Investments, Savings, Income Growth)
-
Investment Gains: If you bought a stock for $100 and it’s now worth $125, that’s a 25% increase. This helps you track the performance of individual assets.
-
Savings Account Growth: If your savings account balance went from $1,000 to $1,020 in a year due to interest, that’s a 2% increase, reflecting your annual interest rate.
-
Income Raises: If your annual salary was $60,000 and increased to $63,000, you received a 5% raise, which helps you understand your real wage growth.
Business Finance Perspective (Revenue Growth, Profitability)
For businesses, percentage increases are fundamental for reporting and strategy:
-
Revenue Growth: A company’s revenue jumped from $1 million last year to $1.2 million this year. That’s a 20% growth rate, a key indicator of market success.
-
Profit Margin Improvement: If gross profit increased from 30% to 33% of revenue, that’s a percentage point increase, but the percentage increase in the margin itself would be
[(33-30)/30]*100 = 10%. This nuance is important for precision.
Common Pitfalls and How to Avoid Them
-
Confusing Percentage Points with Percentage Change: If a profit margin goes from 10% to 15%, that’s a 5 percentage point increase, but a
[(15-10)/10]*100 = 50%percentage change. Always be clear about what you’re referencing. -
Using the Wrong Base Value: Always divide by the original (old) value. Using the new value or an average will yield incorrect results.
-
Ignoring Context: A 100% increase sounds great, but if it’s from $1 to $2, it’s less impactful than a 10% increase from $1 million to $1.1 million.
Calculating Percentage Decrease: Managing Risk and Optimizing Spend
Just as increases signify growth, decreases are equally vital for financial analysis, signaling areas for concern, cost optimization, or market downturns. Understanding percentage decrease helps in risk management and strategic financial planning.
The Basic Formula for Percentage Decrease
The formula for percentage decrease is structurally similar to the increase formula, with a slight adjustment:
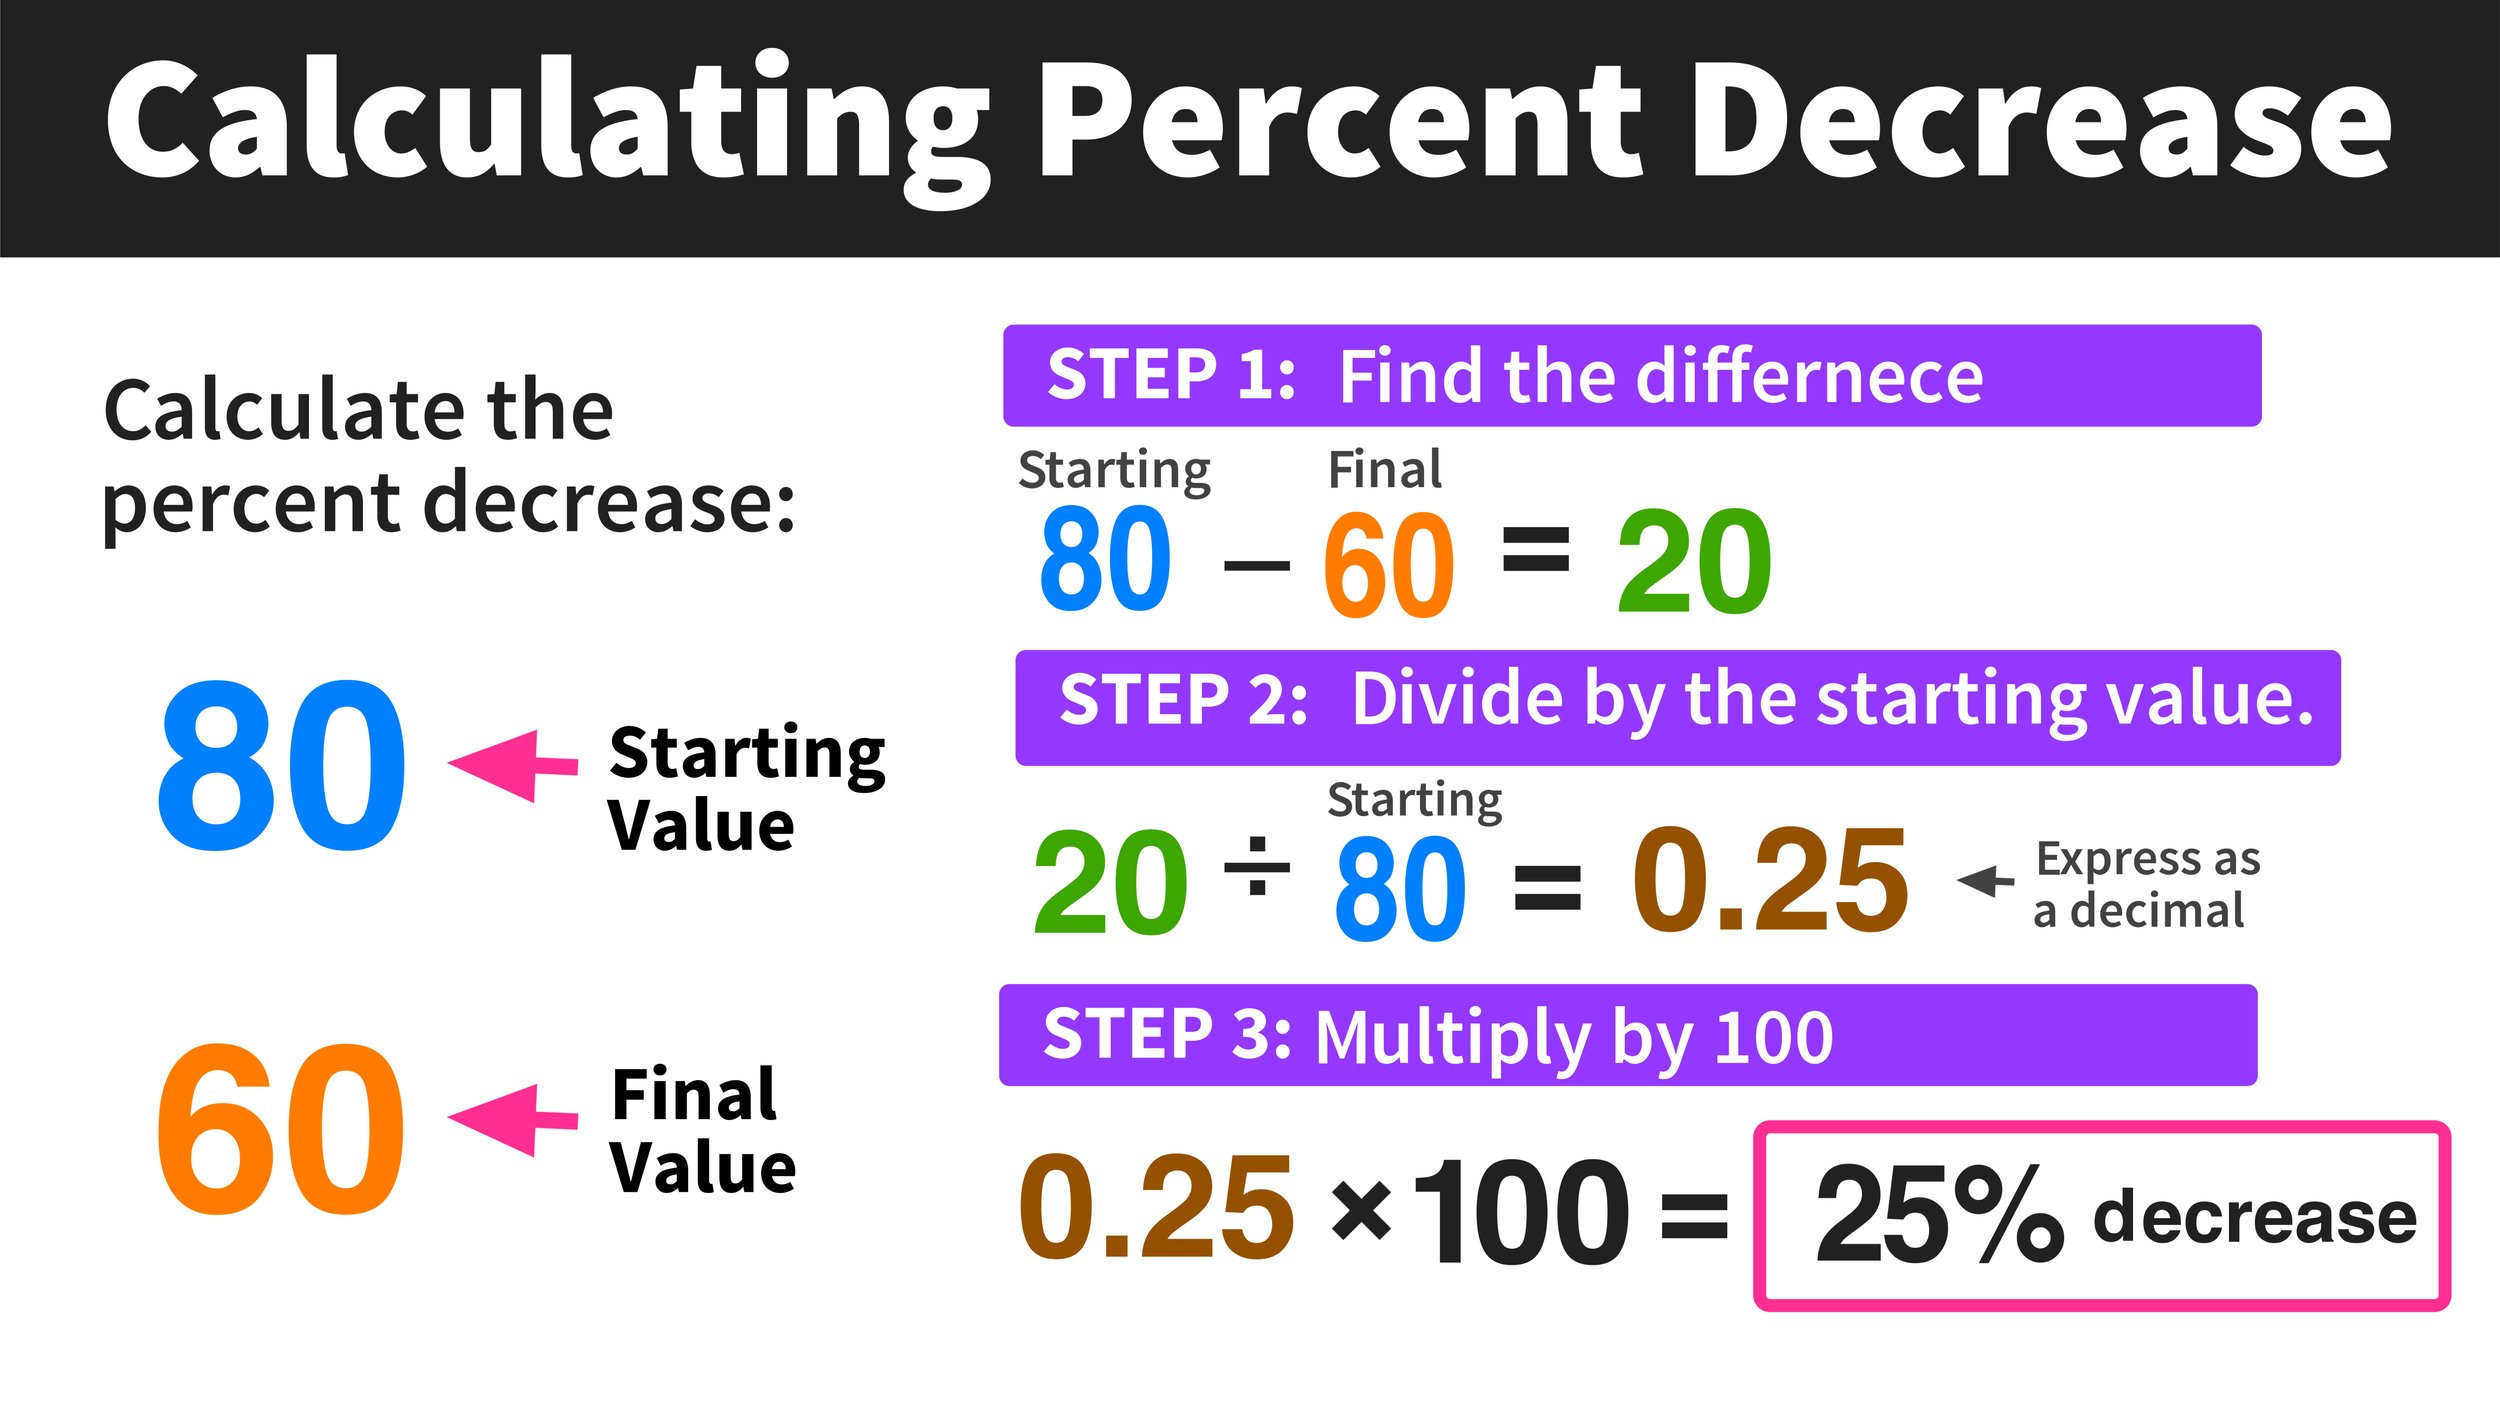
Percentage Decrease = [(Old Value - New Value) / Old Value] * 100
Notice that we subtract the new value from the old value to ensure a positive numerator for the decrease.
Let’s break it down:
-
Find the Difference: Subtract the new value from the old value (
Old Value - New Value). This gives you the absolute decrease. -
Divide by the Original: Divide that absolute decrease by the original (old) value. This expresses the decrease as a decimal proportion.
-
Multiply by 100: Multiply the result by 100 to convert the decimal into a percentage.

Example: The value of a stock you own dropped from $150 to $120.
Decrease = (150 - 120) = 30
Percentage Decrease = (30 / 150) * 100 = 0.20 * 100 = 20%
The stock decreased by 20%.
Real-World Applications in Personal Finance (Expenses, Debt Reduction, Market Declines)
-
Expense Reduction: If you cut your monthly dining out budget from $500 to $350, that’s a
[(500-350)/500]*100 = 30%decrease, freeing up significant funds. -
Debt Reduction: Paying down a credit card balance from $5,000 to $4,000 represents a 20% reduction, a clear sign of progress.
-
Market Declines: During a market correction, knowing a stock has fallen by 15% helps you assess its impact on your portfolio and decide whether to hold, buy more, or sell.
Business Finance Perspective (Cost Reduction, Market Share Decline)
For businesses, understanding percentage decreases is critical for operational efficiency and competitive analysis:
-
Cost Optimization: Reducing manufacturing costs from $10 per unit to $9.50 per unit is a 5% decrease, directly impacting profit margins.
-
Market Share Decline: If a company’s market share falls from 20% to 18%, that’s a
[(20-18)/20]*100 = 10%decrease in market share, signaling competitive pressure. -
Inventory Shrinkage: A decrease in inventory due to spoilage or theft can be quantified as a percentage of total inventory, highlighting operational weaknesses.
Interpreting Significant Decreases
While decreases are often seen negatively, they can also represent positive outcomes (e.g., decrease in expenses, debt, or error rates). The key is to interpret them in context:
-
Negative for Assets/Income: A significant percentage decrease in investments or income often signals financial challenges or market downturns that require immediate attention.
-
Positive for Liabilities/Expenses: A significant percentage decrease in debt or recurring expenses is usually a positive indicator of improved financial health and discipline.
-
Relative Impact: A 50% decrease in a small, non-essential expense is less critical than a 5% decrease in a primary revenue stream.
Beyond Basic Calculations: Advanced Applications and Insights
While the fundamental formulas for percentage increase and decrease are vital, their true power in financial analysis comes from applying them in more sophisticated ways and understanding their implications.
Compound Annual Growth Rate (CAGR) for Long-Term Investments
For investments that grow or shrink over multiple periods, a simple percentage change won’t suffice. The Compound Annual Growth Rate (CAGR) provides a smoothed, annualized rate of return, assuming profits are reinvested. It’s especially useful for comparing investment performance over different durations.
CAGR = [(Ending Value / Beginning Value)^(1 / Number of Years)] - 1
Example: An investment grew from $10,000 to $16,000 over 5 years.
CAGR = [(16,000 / 10,000)^(1 / 5)] - 1
CAGR = [1.6^0.2] - 1 = 1.0985 - 1 = 0.0985 or 9.85%
This tells you the average annual growth rate, assuming compounding, which is a much more insightful metric for long-term financial planning than just the total percentage increase.
Using Percentage Change for Budgeting and Forecasting
Percentage changes are indispensable for effective budgeting.
-
Budget Variance: Comparing actual expenses to budgeted expenses using percentage change (
[(Actual - Budgeted) / Budgeted] * 100) quickly highlights areas where spending is over or under target. -
Forecasting: If sales have historically grown by an average of 8% annually, this percentage can be used to project future revenue, informing strategic decisions and resource allocation.
-
Inflation Adjustments: Understanding percentage changes in inflation rates is crucial for adjusting future income and expense projections to maintain real purchasing power.
Impact on Key Financial Metrics (ROI, Profit Margins)
-
Return on Investment (ROI): Calculated as
[(Net Profit / Cost of Investment) * 100], ROI is inherently a percentage increase that measures the efficiency of an investment. Tracking its percentage change over time or comparing it across different investments is a core financial activity. -
Profit Margins: Gross profit margin, operating profit margin, and net profit margin are all expressed as percentages. Analyzing their percentage change period-over-period reveals trends in a company’s cost structure, pricing strategy, and operational efficiency.
Data Visualization: Making Sense of Percentage Changes
While calculations provide the numbers, visualizing percentage changes through charts and graphs makes them more intuitive and impactful.
-
Bar Charts: Ideal for comparing percentage changes across different categories (e.g., departmental cost reductions).
-
Line Graphs: Excellent for showing trends in percentage change over time (e.g., monthly investment growth).
-
Pie Charts: Can represent proportions, though not ideal for showing changes between periods.
Effective visualization helps in quickly identifying significant shifts and communicating financial performance to stakeholders.
Leveraging Financial Tools for Effortless Calculation and Analysis
While understanding the manual calculation is fundamental, modern financial management benefits immensely from digital tools that automate these processes, reducing errors and saving time.
Spreadsheets (Excel, Google Sheets) for Dynamic Analysis
Spreadsheets are the workhorses of personal and business finance.
-
Formulas: You can easily set up cells to calculate percentage increase or decrease automatically as your data changes.
-
For increase:
=(New_Value_Cell - Old_Value_Cell) / Old_Value_Cell(then format as percentage) -
For decrease:
=(Old_Value_Cell - New_Value_Cell) / Old_Value_Cell(then format as percentage)
-
-
Scenario Planning: You can instantly see the impact of different assumptions (e.g., a 7% vs. a 10% investment return) on future values.
-
Charting: Spreadsheets offer robust charting capabilities to visualize percentage changes as discussed above, making data more digestible.
Online Calculators and Financial Software
Numerous online tools and dedicated financial software simplify these calculations:
-
Percentage Calculators: Quick, one-off calculations for personal use.
-
Investment Calculators: Often include CAGR, ROI, and future value calculations based on percentage growth rates.
-
Budgeting Apps/Software: Many personal finance apps automatically track spending categories and show percentage increases or decreases month-over-month.
-
Business Accounting Software: Platforms like QuickBooks or Xero generate reports showing percentage changes in revenue, expenses, and profitability over different periods, providing crucial business insights.

When to Seek Professional Financial Advice
While basic percentage calculations are accessible to everyone, interpreting complex financial data, especially when it involves significant sums or intricate market dynamics, often benefits from professional guidance.
-
Complex Investment Strategies: If you’re analyzing multi-asset portfolios, derivatives, or alternative investments, a financial advisor can help interpret performance metrics and their implications.
-
Business Financial Health: For significant business expansion plans, mergers, or cost-cutting initiatives, a financial consultant or accountant can provide expert analysis of percentage-based KPIs and their impact.
-
Retirement Planning: Calculating the required percentage growth of your savings to meet retirement goals can be complex, involving inflation, tax considerations, and market volatility.
-
Estate Planning: Understanding the percentage impact of taxes and inheritance rules.
These professionals not only perform the calculations but also provide context, foresee potential pitfalls, and help develop robust financial strategies based on the insights derived from percentage changes.
The ability to calculate and interpret percentage increase or decrease is more than just a mathematical skill; it’s a critical component of financial literacy and strategic decision-making in the money world. From personal budgeting and investment tracking to advanced business finance, these simple formulas unlock a deeper understanding of financial trends, performance, and future potential. By mastering these concepts and leveraging available financial tools, individuals and businesses alike can navigate the financial landscape with greater confidence, make informed choices, and actively work towards their monetary goals.
aViewFromTheCave is a participant in the Amazon Services LLC Associates Program, an affiliate advertising program designed to provide a means for sites to earn advertising fees by advertising and linking to Amazon.com. Amazon, the Amazon logo, AmazonSupply, and the AmazonSupply logo are trademarks of Amazon.com, Inc. or its affiliates. As an Amazon Associate we earn affiliate commissions from qualifying purchases.