
Understanding the percentage increase between two numbers is one of the most fundamental skills in the world of finance. Whether you are an individual investor tracking the growth of a brokerage account, a business owner measuring year-over-year revenue, or a professional negotiating a salary increase, this single calculation provides the clarity needed to make informed decisions. While the mathematical formula is straightforward, its application within the realms of personal finance and corporate strategy is deep and multifaceted.
In financial terms, a percentage increase represents the relative growth of a value compared to its original starting point. It moves beyond simple subtraction to offer a standardized way of measuring performance across different scales. For instance, a $1,000 gain on a $10,000 investment is a 10% increase, whereas a $1,000 gain on a $100,000 investment is only a 1% increase. By focusing on the percentage, we gain a truer sense of momentum and efficiency.
The Fundamental Formula for Financial Growth
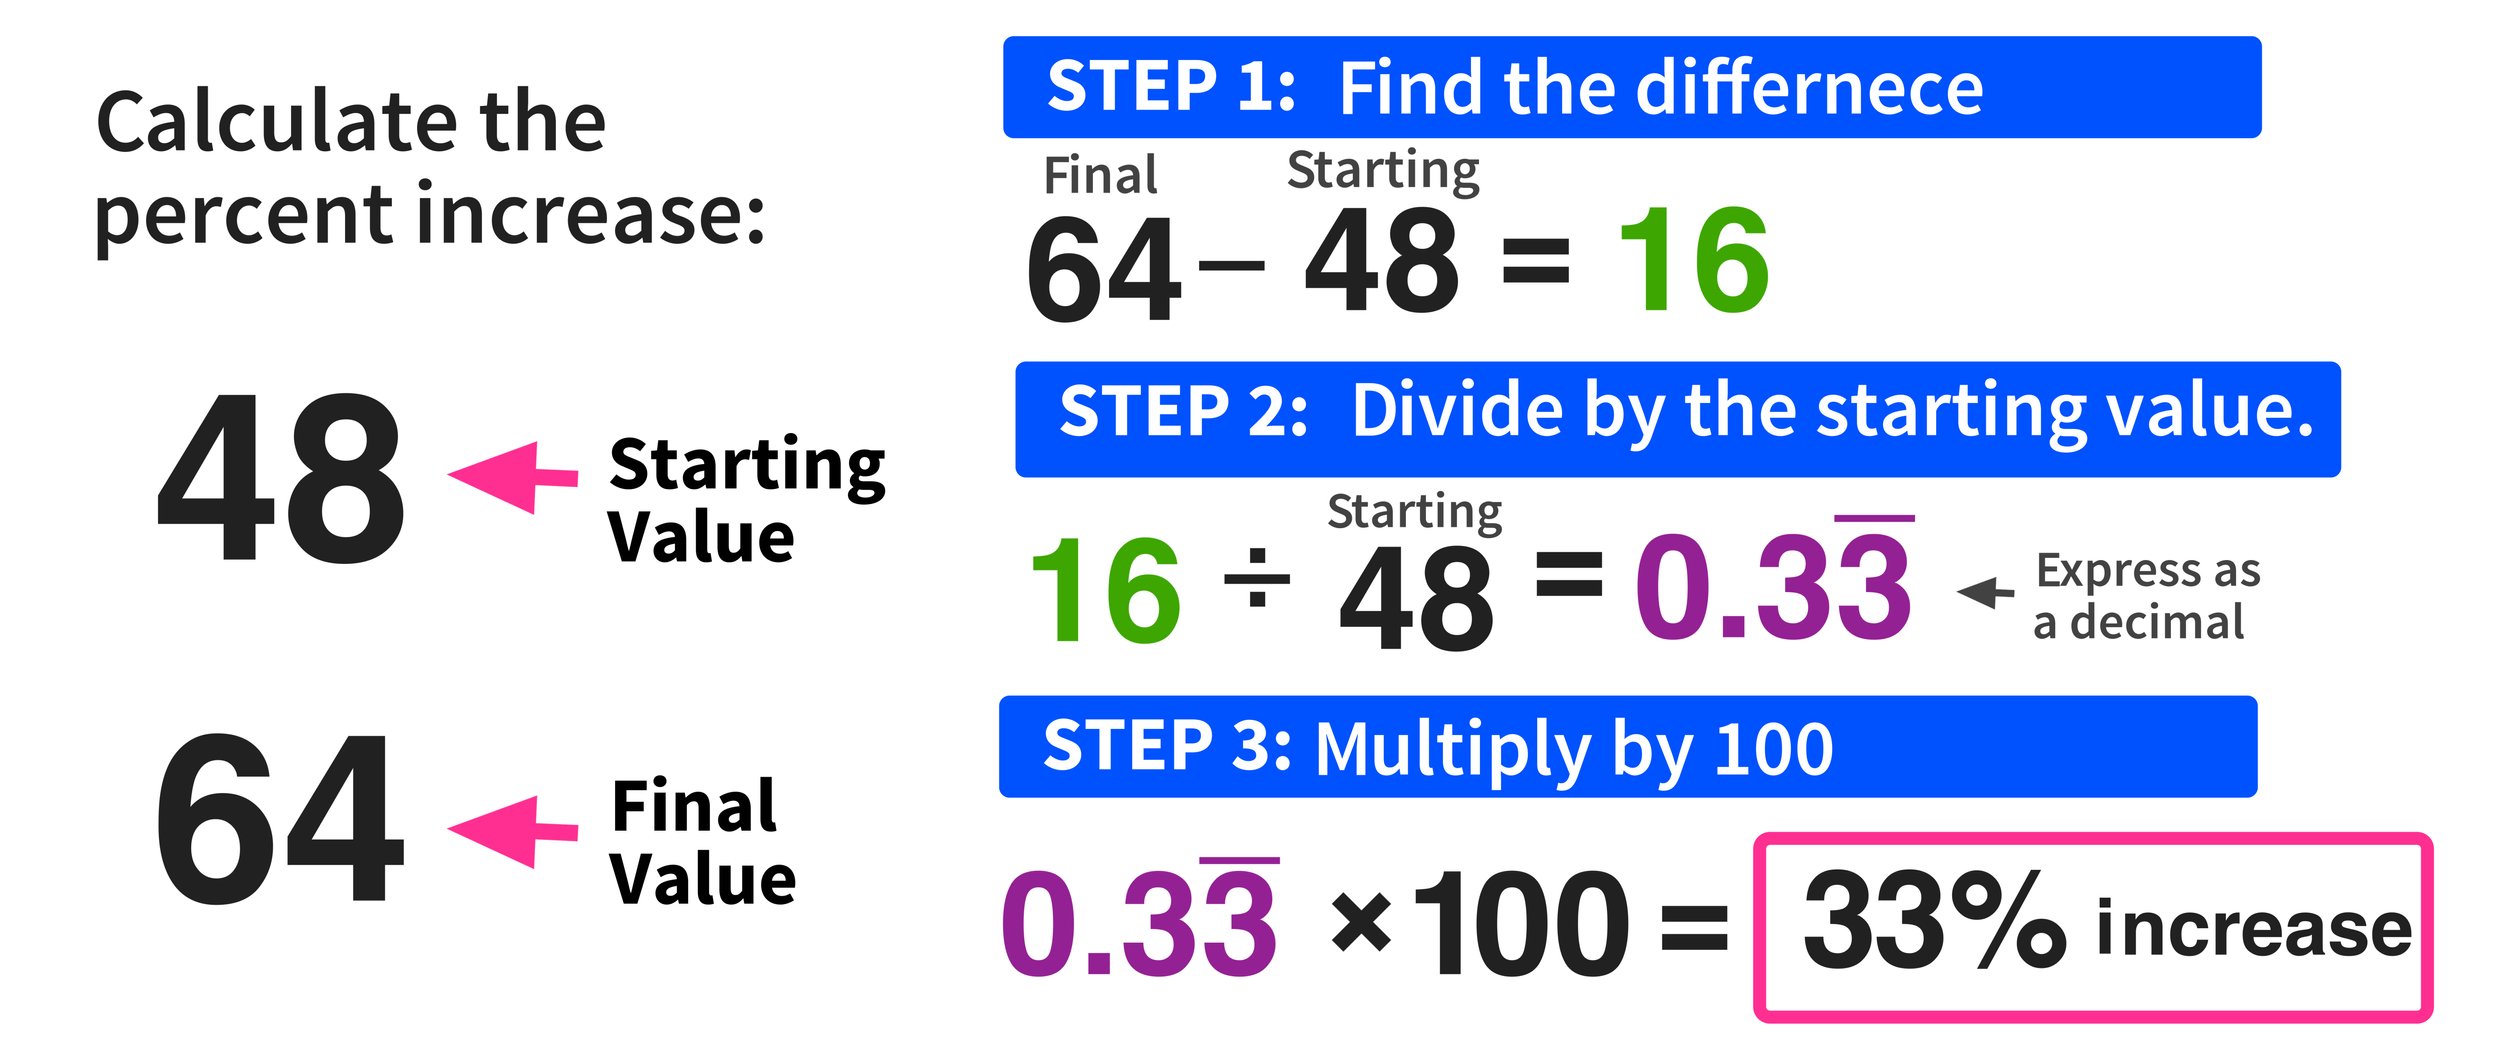
To calculate the percentage increase between two numbers, you must follow a specific sequence of operations. This formula is the bedrock of financial analysis, used by everyone from retail day traders to Wall Street analysts.
The Step-by-Step Calculation
The standard formula for percentage increase is:
[(New Value – Original Value) / Original Value] × 100 = Percentage Increase
-
Subtract the Original Value from the New Value: This gives you the “absolute increase” or the raw gain in dollars, units, or points.
-
Divide the Result by the Original Value: This step is crucial because it contextualizes the gain. It turns the raw number into a fraction of the starting amount.
-
Multiply by 100: This converts the decimal figure into a percentage, making it easier to compare against other financial benchmarks like inflation or interest rates.
Real-World Example: Stock Performance
Imagine you purchased shares of a technology company at $150 per share. Twelve months later, the stock is trading at $195.
-
First, subtract the original price from the new price: $195 – $150 = $45.
-
Next, divide that gain by the original price: $45 / $150 = 0.3.
-
Finally, multiply by 100 to get 30%.
In this scenario, your investment has seen a 30% percentage increase. Understanding this figure allows you to compare this stock’s performance against the S&P 500 or a high-yield savings account.
Applying Percentage Increase to Personal Wealth Management
In personal finance, tracking percentage increases is more than just an academic exercise; it is a tool for survival and wealth accumulation. When we look at our net worth, our savings, or our expenses, the rate of change tells us whether we are moving toward financial independence or falling behind.
Measuring Investment Returns (ROI)
The Return on Investment (ROI) is essentially a percentage increase calculation applied to capital. However, sophisticated investors also look at “Annualized Percentage Increase.” If an investment grows by 20% over five years, that is very different from an investment that grows 20% in five months. By mastering the basic percentage increase formula, you can begin to calculate CAGR (Compound Annual Growth Rate), which provides a smoothed annual rate of return that accounts for the effects of compounding.
Navigating Inflation and Purchasing Power
One of the most critical uses of this calculation is assessing the real value of a salary raise. If you receive a 5% raise at work, but the Consumer Price Index (CPI) shows that the cost of living has seen a 7% percentage increase, your “real” income has actually decreased. By calculating the percentage increase of your monthly expenses—rent, groceries, and utilities—you can determine if your income growth is outpacing the devaluation of currency.
Debt Reduction and Interest Impact
Percentage calculations also work in reverse when looking at debt. If you are paying down a credit card balance, you can calculate the percentage decrease in your liabilities. Conversely, understanding how interest rates apply to your principal balance allows you to see how much your debt “grows” each month. For example, if you have a $5,000 balance and the interest adds $100 this month, that is a 2% monthly increase in debt, which equates to a significant annual drag on your net worth.
Business Metrics and Corporate Financial Health
For entrepreneurs and corporate executives, the percentage increase is the primary language of the quarterly earnings report. It is used to communicate health, scalability, and market share to stakeholders and investors.

Revenue and Profit Margin Growth
Businesses use percentage increase to track Year-Over-Year (YoY) and Quarter-Over-Quarter (QoQ) growth. If a startup generated $500,000 in revenue in Year 1 and $1.2 million in Year 2, the percentage increase is 140%. This tells a much more compelling story of hyper-growth than simply stating the raw dollar increase.
Furthermore, calculating the percentage increase in “Gross Profit” versus “Operating Expenses” is vital for sustainability. If your revenue increases by 10% but your expenses increase by 15%, your business is becoming less efficient despite making more money. Monitoring these divergent percentages allows managers to pivot before a cash flow crisis occurs.
Scalability and Customer Acquisition
In the digital economy, businesses track the percentage increase in their user base or subscriber list. A 5% monthly increase in active users is a common benchmark for healthy SaaS (Software as a Service) companies. Additionally, marketers use this formula to measure the effectiveness of campaigns. If a social media ad campaign increases website traffic from 10,000 visits to 15,000 visits, that 50% increase justifies the marketing spend.
Inventory and Supply Chain Costs
Wholesalers and retailers must constantly monitor the percentage increase in the cost of goods sold (COGS). If a manufacturer raises the price of a raw material by 12%, the business must decide whether to absorb that cost or increase their own retail prices by a corresponding percentage to maintain their margins. Without precise percentage tracking, these small shifts can quietly erode a company’s bottom line.
Advanced Financial Tools and Automation
While the manual formula is essential for understanding the underlying logic, modern financial management relies on tools to handle these calculations at scale.
Utilizing Excel and Google Sheets
For most financial professionals, spreadsheets are the primary environment for calculating growth. In Excel, if your original value is in cell A1 and your new value is in cell B1, the formula is simple: =(B1-A1)/A1. By formatting the resulting cell as a “Percentage,” the software automatically handles the multiplication by 100. This allows for the rapid analysis of massive datasets, such as tracking the daily percentage fluctuations of an entire portfolio of stocks.
Financial Calculators and Fintech Apps
There are numerous specialized financial tools designed to automate growth tracking. Portfolio trackers like Morningstar or Personal Capital automatically display the percentage increase of your assets over various time horizons (1D, 5D, 1M, YTD, 1Y). For business owners, accounting software like QuickBooks or Xero provides automated “Trend Reports” that highlight percentage changes in cash flow, allowing for proactive financial management.
The Role of AI in Predictive Growth
The next frontier in financial percentage calculations is predictive analytics. AI-driven financial tools now look at historical percentage increases to forecast future trends. By analyzing the “Rate of Change” (the speed at which the percentage increase is itself increasing or decreasing), these tools can alert investors to potential market bubbles or business owners to slowing demand before it shows up in raw sales numbers.
The Strategic Importance of Tracking Growth Rates
Ultimately, knowing how to find the percentage increase between two numbers is about more than just math; it is about perspective. In finance, numbers are rarely meaningful in isolation. They require context to become actionable data.
Setting Financial Benchmarks
By calculating percentage increases, you can set meaningful goals. Instead of saying “I want to save more money,” you can say “I want to increase my savings rate by 10% this year.” This provides a measurable target that is independent of your specific income level. It allows for a “gamified” approach to wealth building where the objective is to optimize the growth rate of your assets.
Identifying Patterns and Anomalies
Consistently calculating growth helps in spotting outliers. If your utility bill usually sees a 2% seasonal increase but suddenly jumps by 25%, the percentage highlights a problem—perhaps a leak or a faulty meter—that a raw dollar amount might not have made as obvious. In investing, if a particular asset class suddenly shows a percentage increase that is significantly higher than its historical average, it may signal an overvalued market or a unique opportunity.

The Power of Compounding
Perhaps the most profound realization that comes from mastering percentage increase is an understanding of compounding. A 10% increase on $100 brings you to $110. The next 10% increase is not based on the original $100, but on the new $110, bringing you to $121. Over long periods, these incremental percentage increases build upon one another, creating the exponential growth curves that characterize successful long-term investing.
In conclusion, the ability to calculate and interpret the percentage increase between two numbers is a foundational pillar of financial literacy. It bridges the gap between simple arithmetic and strategic wealth management. Whether applied to personal budgets, investment portfolios, or corporate balance sheets, this calculation provides the clarity required to navigate an increasingly complex economic landscape. By focusing on the rate of change, you empower yourself to see the true direction of your financial journey.
aViewFromTheCave is a participant in the Amazon Services LLC Associates Program, an affiliate advertising program designed to provide a means for sites to earn advertising fees by advertising and linking to Amazon.com. Amazon, the Amazon logo, AmazonSupply, and the AmazonSupply logo are trademarks of Amazon.com, Inc. or its affiliates. As an Amazon Associate we earn affiliate commissions from qualifying purchases.