
In the realm of business finance, few metrics are as vital as the sales percentage. Whether you are evaluating the year-over-year growth of a startup, calculating the commission for a high-performing sales team, or analyzing the gross profit margins of a multinational corporation, understanding how to compute and interpret sales percentages is fundamental. These figures serve as the pulse of an organization’s financial health, providing a standardized way to compare performance across different time periods, product lines, and even competitors.
For the modern entrepreneur or financial analyst, the ability to distill raw revenue data into actionable percentages is what separates a reactive business from a proactive one. Percentages provide context where raw numbers often fail. For instance, knowing that a company earned $100,000 more this year than last is useful, but knowing that this represents a 2% growth in a market expanding at 10% reveals a critical underlying issue. This guide explores the various dimensions of sales percentage calculations, providing the formulas and financial insights necessary to master your business’s bottom line.

Understanding Sales Growth Percentages: Tracking Your Financial Trajectory
Sales growth is perhaps the most scrutinized percentage in any financial report. It tells investors and stakeholders whether the company is expanding its reach or stagnating. Computing this figure involves comparing revenue from two distinct periods to determine the rate of change.
The Year-Over-Year (YoY) Growth Formula
The Year-Over-Year calculation is the gold standard for assessing long-term health, as it smooths out seasonal fluctuations. To compute the YoY sales growth percentage, you use the following formula:
((Current Period Sales – Previous Period Sales) / Previous Period Sales) x 100
For example, if your business generated $500,000 in revenue in 2022 and $650,000 in 2023, the calculation would be:
(($650,000 – $500,000) / $500,000) x 100 = 30%.
A 30% growth rate indicates a robust upward trajectory. However, in professional finance, it is essential to look beneath the surface. Was this growth driven by an increase in units sold (volume growth) or simply by raising prices (price growth)? Distinguishing between the two is vital for long-term strategic planning.
Month-Over-Month (MoM) Analysis for Short-Term Agility
While YoY provides the “big picture,” Month-Over-Month (MoM) calculations allow for tactical adjustments. This is particularly important for businesses in fast-moving industries or those utilizing digital marketing where spend can be scaled up or down instantly. The formula remains the same, but the timeframe narrows.
MoM analysis helps identify immediate reactions to specific events, such as a new product launch or a holiday sale. If a business sees a 15% drop MoM during a period that usually sees growth, it serves as an early warning system to investigate supply chain disruptions, competitive price cuts, or shifts in consumer behavior before they impact the annual bottom line.
Compound Annual Growth Rate (CAGR)
For a more sophisticated view of sales percentage over several years, financial professionals use the Compound Annual Growth Rate (CAGR). Unlike simple growth percentages, CAGR accounts for the effect of compounding. It represents the mean annual growth rate of an investment over a specified period of time longer than one year. This provides a smoothed representation of growth, making it easier to compare the performance of different revenue streams or investment opportunities.
Calculating Sales Margin Percentages: The Key to Sustainable Profitability
Revenue is vanity, but profit is sanity. Computing sales as a percentage of cost or total revenue—commonly known as margin analysis—is where true financial control begins. A business can have massive sales figures but still face bankruptcy if its margin percentages are mismanaged.
Gross Profit Margin vs. Net Profit Margin
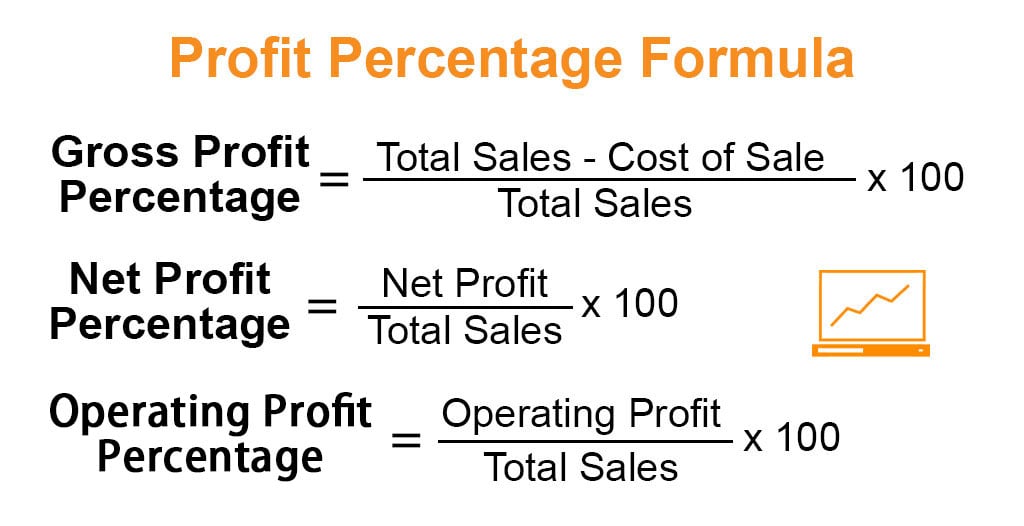
The Gross Profit Margin percentage measures the efficiency of a company’s production or service delivery. It is calculated by taking the Gross Profit (Total Sales minus Cost of Goods Sold) and dividing it by the Total Sales, then multiplying by 100.
((Total Revenue – COGS) / Total Revenue) x 100 = Gross Profit Margin %
If a company sells a product for $100 and it costs $60 to manufacture, the gross profit margin is 40%. This percentage must be high enough to cover all other operating expenses, including rent, marketing, and payroll.
The Net Profit Margin is even more revealing. It takes into account every single expense, including taxes and interest. This is the “final” percentage that tells you how much of every dollar earned actually stays in the business’s pocket. In high-volume, low-margin industries like grocery retail, a net profit margin of 2% might be acceptable, whereas software-as-a-service (SaaS) companies often aim for 20% or higher.
Markup vs. Margin: Avoiding the Common Trap
One of the most frequent errors in business finance is confusing markup percentage with margin percentage. While they use the same inputs (cost and price), the denominator is different.
-
Markup is the percentage of the cost added to the cost to reach the selling price.
-
Margin is the percentage of the selling price that is profit.
If an item costs $80 and you sell it for $100, the markup is 25% ($20 is 25% of $80). However, the profit margin is only 20% ($20 is 20% of $100). Miscalculating this can lead to disastrous pricing strategies where a business owner thinks they are making more profit than they actually are.
Identifying Low-Margin vs. High-Margin Revenue Streams

Computing sales percentages by product category allows a business to perform a “Sales Mix” analysis. By identifying which products contribute the highest percentage to the total margin versus those that contribute the highest percentage to total volume, a business can optimize its portfolio. Often, 20% of products generate 80% of the profit. Finance teams use these percentages to decide which products to phase out and which to put more marketing capital behind.
Market Share and Sales Mix Percentages: Gauging Competitive Strength
Internal growth metrics only tell half the story. To understand a business’s true standing, one must compute sales percentages in the context of the broader market and the internal product ecosystem.
Computing Market Share Percentage
Market share is a calculation of a company’s sales as a percentage of the total sales in its industry over a specific period.
** (Company’s Total Sales / Total Industry Sales) x 100 = Market Share %**
This percentage is a primary indicator of competitiveness. A rising market share percentage suggests that your marketing and value proposition are outperforming competitors. Conversely, if your sales are growing by 5% but your market share is shrinking, it means the industry is growing faster than you are, and you are effectively losing your grip on the market.
Sales Mix Percentage: Which Products Drive the Revenue?
The sales mix percentage identifies what proportion of total revenue comes from specific products or services.
(Product Category Sales / Total Company Sales) x 100 = Sales Mix %
Understanding the sales mix is crucial for risk management. If 90% of a company’s revenue comes from a single product, the business is highly vulnerable to market shifts or technological obsolescence. Diversifying the sales mix and monitoring these percentages ensures that the financial foundation of the company is balanced and resilient.
Sales Commissions and Incentive Calculations: Managing Human Capital Costs
In many organizations, sales percentages are used not just for reporting, but as a mechanism for compensation. Computing commission percentages accurately is essential for maintaining a motivated sales force while protecting the company’s financial interests.
Tiered Commission Structures
Many businesses use tiered sales percentages to incentivize high performance. For example, a salesperson might earn 5% on the first $50,000 of sales, 7% on the next $50,000, and 10% on anything over $100,000.
Computing these requires a “bucket” approach to accounting. If a salesperson hits $120,000 in sales, the calculation isn’t a flat 10%. Instead, it is:
-
($50,000 x 0.05) = $2,500
-
($50,000 x 0.07) = $3,500
-
($20,000 x 0.10) = $2,000
-
Total Commission: $8,000
From a financial management perspective, it is vital to calculate the Effective Commission Rate (Total Commission / Total Sales). In this case, $8,000 / $120,000 = 6.67%. Managers must ensure that the effective commission rate does not erode the net profit margin to an unsustainable level.
The Impact of Return Rates on Sales Percentage Payouts
A professional financial system must also compute the “Net Sales” percentage when dealing with commissions. If a salesperson closes $100,000 in deals, but $20,000 worth of products are returned by customers, the commission should be calculated on the net sales ($80,000). Failing to account for returns in sales percentage calculations can lead to “phantom revenue” and overpayment of incentives.
Advanced Tools and Techniques for Sales Financial Modeling
As businesses scale, manual calculations become prone to error and inefficiency. Utilizing financial tools and modeling techniques ensures that sales percentages are computed with precision and integrated into broader financial forecasts.
Automating Calculations with Financial Software
Modern ERP (Enterprise Resource Planning) and CRM (Customer Relationship Management) systems automate the computation of sales percentages in real-time. These tools allow for “Slicing and Dicing” of data—calculating sales growth percentages by region, by individual sales representative, or by customer demographic at the click of a button.
Automation also allows for the calculation of the “Sales-to-Expense Ratio.” This percentage compares the cost of the sales department (salaries, travel, software) against the revenue generated. A healthy sales-to-expense ratio indicates an efficient sales engine.
Avoiding Common Pitfalls in Sales Percentage Reporting
One of the biggest risks in sales percentage computation is the “Base Effect.” This occurs when a small initial number makes a percentage increase look much larger than it is. A company that goes from $1,000 in sales to $3,000 has a 200% growth rate, while a company that goes from $1,000,000 to $1,100,000 has only a 10% growth rate. However, the latter company has generated significantly more value.
Always provide the absolute numbers alongside the percentages to give a full financial picture. Furthermore, ensure that “Sales” is defined consistently—whether it refers to gross bookings, recognized revenue, or cash collected. In the world of finance, clarity in how these percentages are computed is just as important as the resulting numbers themselves. By mastering these calculations, you gain the clarity needed to steer a business toward long-term profitability and success.
aViewFromTheCave is a participant in the Amazon Services LLC Associates Program, an affiliate advertising program designed to provide a means for sites to earn advertising fees by advertising and linking to Amazon.com. Amazon, the Amazon logo, AmazonSupply, and the AmazonSupply logo are trademarks of Amazon.com, Inc. or its affiliates. As an Amazon Associate we earn affiliate commissions from qualifying purchases.