
In the landscape of business finance and investment analysis, few metrics are as pivotal as Marginal Revenue (MR). For business owners, financial analysts, and entrepreneurs, understanding how to calculate and interpret MR is the difference between scaling a profitable enterprise and overextending a failing one. While total revenue provides a snapshot of a company’s size, Marginal Revenue offers a precise look at its efficiency and future potential. It answers a fundamental question: “Is the next unit I sell actually worth the effort?”
This guide explores the intricate details of Marginal Revenue, providing a step-by-step breakdown of its calculation, its relationship with marginal costs, and how it dictates pricing strategies in various market environments.

Understanding the Fundamentals of Marginal Revenue
To master the calculation of MR, one must first grasp its theoretical foundation. In economics and business finance, the term “marginal” refers to the change that occurs by producing or selling one additional unit. Therefore, Marginal Revenue is the increase in total revenue that results from the sale of exactly one additional unit of output.
What is Marginal Revenue?
At its core, MR measures the rate of change in total revenue. In a perfectly competitive market, where a business can sell as many units as it wants at a fixed market price, MR is equal to the price of the product. However, in most real-world scenarios—such as those involving branding, niche markets, or monopolies—the relationship is more complex. As a business increases production, it often has to lower its price to attract more customers, which causes MR to diverge from the unit price.
The Role of MR in Business Finance
Marginal Revenue is a cornerstone of microeconomic analysis and corporate financial planning. It is used to determine the optimal level of production. Financial managers rely on MR to evaluate whether an expansion in operations will yield a positive return. If the revenue generated by the “next” unit exceeds the cost of producing it, the company is moving toward greater profitability. Conversely, if MR begins to fall below the cost of production, the company is effectively losing money on every new sale, even if total revenue is still increasing.
The Step-by-Step Formula for Calculating MR
Calculating Marginal Revenue is a straightforward mathematical process, provided you have accurate data regarding your total revenue and units sold. The precision of this calculation depends on the quality of your financial tracking and your ability to segment sales data over specific periods.
The Core Equation
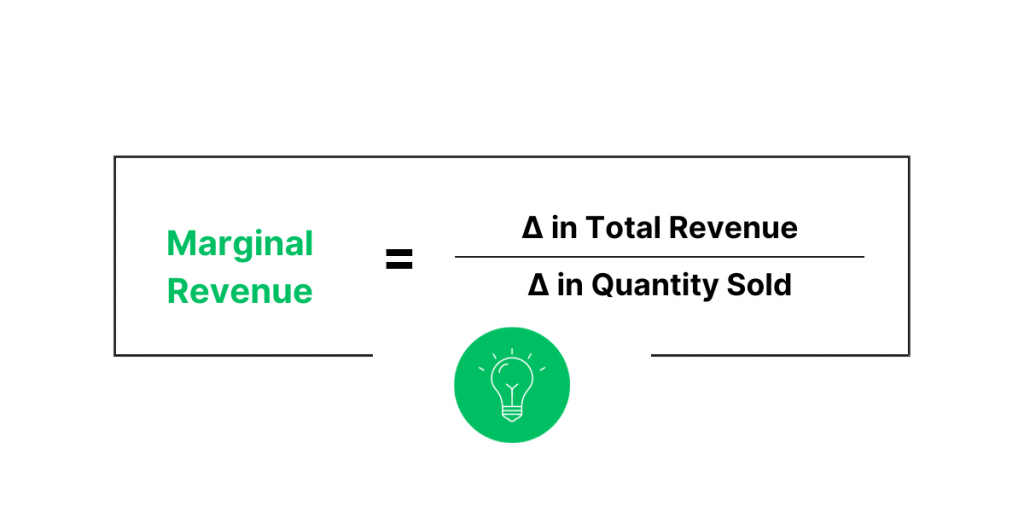
The standard formula for Marginal Revenue is:
Marginal Revenue = Change in Total Revenue / Change in Quantity
Mathematically, this is expressed as:
MR = ΔTR / ΔQ
Where:
-
ΔTR (Change in Total Revenue): Total Revenue (New) – Total Revenue (Old)
-
ΔQ (Change in Quantity): Total Quantity (New) – Total Quantity (Old)
A Practical Example Walkthrough
Imagine a boutique electronics firm that sells high-end headphones. To calculate the MR, the financial team examines two consecutive periods of sales:
-
Initial State: The company sells 100 units at $200 each.
- Total Revenue = 100 * $200 = $20,000.
-
Second State: To increase volume, the company lowers the price to $190 and sells 110 units.
- Total Revenue = 110 * $190 = $20,900.
Calculating the components:
-
Change in Total Revenue (ΔTR) = $20,900 – $20,000 = $900.
-
Change in Quantity (ΔQ) = 110 – 100 = 10 units.
Applying the formula:
- MR = $900 / 10 = $90.
In this scenario, even though the headphones are being sold for $190, the Marginal Revenue for each of those 10 additional units is only $90. This happens because the price reduction applied to the first 100 units (to maintain a single price point across the market) “eats into” the gains made by the new sales.
Visualizing MR through the Revenue Curve
In financial modeling, MR is often plotted on a graph alongside the demand curve. In most markets, the demand curve slopes downward, meaning that to sell more, prices must drop. Because the price must drop for all units sold, the MR curve will always lie below the demand (Price) curve. Understanding this visual relationship helps financial planners predict at what point further sales will become counterproductive.
Marginal Revenue vs. Marginal Cost: Finding the Profit Maximization Point
Calculating MR is only half of the equation for financial success. To make informed business decisions, MR must be compared against Marginal Cost (MC). Marginal Cost is the expense incurred by producing one additional unit. The interplay between these two metrics is what defines a company’s “Profit Maximization” point.
The MR = MC Rule
The golden rule of business finance states that profit is maximized when Marginal Revenue equals Marginal Cost (MR = MC).
-
When MR > MC: The company should increase production. Every additional unit sold adds more to revenue than it adds to costs, thereby increasing total profit.
-
When MR < MC: The company should decrease production. Each additional unit sold costs more to make than it brings in, which erodes total profit.
-
When MR = MC: The company has reached its optimal output. At this point, the business is squeezing every possible cent of profit out of its current operational structure.
Impact of Diminishing Returns
The concept of diminishing marginal returns plays a significant role in these calculations. As a business scales, it may encounter “diseconomies of scale.” For instance, a factory might become overcrowded, requiring more expensive overtime pay for workers or causing machinery to break down more frequently. This increases the Marginal Cost. If the Marginal Cost rises while the Marginal Revenue falls (due to market saturation), the window for profit narrows quickly. Financial tools and forecasting models are essential here to identify this “sweet spot” before the business begins to over-invest in growth that yields no net return.
Applying MR Calculations to Pricing Strategy and Market Structure
The way a business calculates and reacts to MR depends heavily on the market structure in which it operates. Different competitive environments dictate different relationships between price and revenue.
MR in Competitive Markets
In a perfectly competitive market, there are many buyers and sellers, and products are largely homogenous. Here, the business is a “price taker.” Because the market dictates the price, the company can sell as much as it wants at that price. In this specific (and somewhat rare) case, MR remains constant and is equal to the Price (P).
Calculation: If the price is $50, the MR for the 1st, 10th, and 100th unit is always $50.
MR in Monopolistic Environments
In markets where a brand has significant power or a unique product (monopolistic competition or a pure monopoly), the business is a “price maker.” To sell more, it must lower the price. This creates a steeper decline in the MR curve.
Strategic managers use MR calculations to determine if a “High-Price, Low-Volume” strategy or a “Low-Price, High-Volume” strategy is more financially sound. By calculating the MR for different price points, a brand can find the equilibrium that maximizes its corporate identity and its bottom line simultaneously.
Price Elasticity and MR
The calculation of MR is deeply linked to price elasticity of demand. If demand is elastic (consumers are sensitive to price changes), a small drop in price can lead to a massive surge in quantity sold, keeping MR high. If demand is inelastic (consumers buy the same amount regardless of price), lowering the price will cause MR to plummet, often becoming negative. Financial analysts use MR to identify these thresholds, ensuring that promotional discounts or price hikes are backed by data rather than intuition.
Beyond the Basics: Calculating Monthly Recurring Revenue (MRR)
In the modern digital economy, particularly for SaaS (Software as a Service) and subscription-based businesses, “MR” often refers to Monthly Recurring Revenue (MRR). While distinct from the economic concept of Marginal Revenue, MRR is equally vital for business finance and valuation.
Why Subscription Models Change the Math
Unlike traditional sales, where revenue is a one-time event, subscription models focus on the predictability of income. Calculating MRR allows a business to understand its baseline cash flow and growth trajectory.
Key Components of MRR Growth
To calculate the total MRR for a period, a business must account for several moving parts:
-
New MRR: Revenue from brand-new customers acquired during the month.
-
Expansion MRR: Revenue from existing customers who upgraded their plans (Upselling).
-
Churn MRR: Revenue lost from customers who canceled their subscriptions.
-
Net New MRR: (New MRR + Expansion MRR) – Churn MRR.
While Marginal Revenue tells you if your next unit is profitable, MRR tells you if your entire business model is sustainable over the long term. For an investor, a high MRR combined with a positive Marginal Revenue indicates a business that is not only stable but also highly efficient in its acquisition of new revenue streams.

Integrating MR into Long-Term Financial Planning
Mastering the calculation of MR is not merely an academic exercise; it is a fundamental requirement for sophisticated financial management. By consistently monitoring the change in revenue relative to the change in output, businesses can avoid the trap of “growth for growth’s sake.”
Effective financial planning involves using MR to set sales targets, determine marketing budgets, and evaluate the feasibility of new product lines. When paired with an understanding of Marginal Costs and market elasticity, MR becomes a powerful tool for navigating complex economic shifts. Whether you are looking at the microeconomic “Marginal Revenue” of a manufactured good or the “Monthly Recurring Revenue” of a digital platform, the goal remains the same: using precise mathematical insights to drive sustainable, profitable growth.
aViewFromTheCave is a participant in the Amazon Services LLC Associates Program, an affiliate advertising program designed to provide a means for sites to earn advertising fees by advertising and linking to Amazon.com. Amazon, the Amazon logo, AmazonSupply, and the AmazonSupply logo are trademarks of Amazon.com, Inc. or its affiliates. As an Amazon Associate we earn affiliate commissions from qualifying purchases.