
In the world of finance, percentages are the universal language of progress, risk, and value. Whether you are tracking the growth of a retirement portfolio, calculating the interest on a high-yield savings account, or determining the tax implications of a new investment, understanding how to derive a percentage from two numbers is a fundamental skill. At its core, a percentage is a way to express a number as a fraction of 100, providing a standardized scale to compare different financial scenarios that might otherwise seem unrelated.
For many, the mathematical formula remains a distant memory from high school classrooms. However, in professional and personal finance, this simple calculation is the bridge between raw data and actionable insights. Mastery of this concept allows you to move beyond “guessing” your financial health and into a space of precision and strategic planning.

Understanding the Core Mathematical Framework in Finance
The logic behind calculating a percentage is rooted in the relationship between a “part” and a “whole.” To find what percentage one number is of another, you follow a straightforward sequence: divide the part by the total (the whole) and then multiply the resulting decimal by 100.
The Basic Percentage Formula
The standard formula is written as:
(Part / Whole) × 100 = Percentage (%)
For example, if you earned $1,200 in dividends this year from a total investment portfolio of $40,000, you would divide 1,200 by 40,000 to get 0.03. Multiplying 0.03 by 100 gives you 3%. This tells you that your portfolio yielded a 3% return in dividends.
Why Precision Matters in Wealth Management
In finance, even a fraction of a percentage point can result in thousands of dollars of difference over time. Consider the impact of an expense ratio on a mutual fund. A fee of 0.75% versus 1.25% might seem negligible at first glance, but when applied to a large principal over thirty years, the “part” (the fee) consumes a significantly larger “percentage” of your total wealth. Understanding how to calculate these ratios yourself empowers you to audit your financial advisors, your bank statements, and your investment platforms to ensure your capital is working as efficiently as possible.
Practical Applications in Personal Finance and Budgeting
Budgeting is essentially an exercise in percentage allocation. Without the ability to see your spending as a percentage of your income, it is difficult to determine if your lifestyle is sustainable or if you are over-extended in specific categories.
Calculating Savings Rates
One of the most critical metrics for long-term wealth building is your savings rate. This is the percentage of your take-home pay that remains after all expenses are met. To find this, take your total monthly savings (the part) and divide it by your total monthly net income (the whole).
If you bring home $5,000 a month and save $1,000, your savings rate is 20%. Financial experts often suggest a target savings rate of 15% to 25% for a comfortable retirement. By calculating this percentage monthly, you can track your progress and adjust your spending habits in real-time.
Debt-to-Income Ratio Analysis
Lenders use percentages to determine your creditworthiness, specifically through the Debt-to-Income (DTI) ratio. To calculate your DTI, you divide your total monthly debt payments by your gross monthly income.
If your monthly debt (mortgage, car loan, student loans) totals $2,000 and your gross income is $6,000, your DTI is 33.3%. Most mortgage lenders look for a DTI of 36% or lower. Knowing how to calculate this number allows you to see yourself through the eyes of a creditor before you ever apply for a loan, giving you the chance to pay down debt and improve your financial standing.
Tracking Expense Categories
The famous 50/30/20 rule of budgeting suggests that 50% of your income should go to needs, 30% to wants, and 20% to savings. To see if you are adhering to this, you must categorize your spending and calculate the percentage of each category against your total income. If your “needs” (rent, utilities, groceries) are consuming 65% of your income, the percentage calculation highlights exactly where the pressure on your budget is coming from, allowing for targeted reductions.
Mastering Investment Mathematics
Investing is the art of maximizing percentages. Whether you are looking at capital gains, dividend yields, or interest rates, the ability to compare two numbers to find a percentage is what separates an amateur from a disciplined investor.

Calculating Return on Investment (ROI)
The most common use of percentages in the stock market is calculating the Return on Investment (ROI). This requires a slightly different approach because you are looking for the percentage of change between two numbers: the initial cost and the final value.
The formula for ROI is:
[(Current Value – Original Cost) / Original Cost] × 100 = ROI%
If you bought a stock for $150 and sold it for $200, your profit is $50. To find the percentage gain, you divide the $50 profit by the original $150 cost, resulting in 0.333, or a 33.3% ROI. This calculation is vital because it allows you to compare the performance of different assets regardless of their price. A $10 gain on a $20 stock (50%) is far more impressive than a $10 gain on a $1,000 stock (1%).
Dividend Yields and Portfolio Allocation
Dividend yield is a financial ratio that shows how much a company pays out in dividends each year relative to its stock price. It is calculated by dividing the annual dividend per share by the current share price. For an income-focused investor, knowing how to calculate this percentage is essential for comparing the cash-flow potential of various stocks.
Furthermore, portfolio allocation is entirely based on percentages. If you want a diversified portfolio, you might aim for 60% equities and 40% bonds. To check your current status, divide the total value of your stocks by the total value of your entire portfolio. If the resulting percentage is 75%, you know you are over-weighted in equities and may need to rebalance to mitigate risk.
Business Finance: Profit Margins and Markup
In the business world, percentages are the primary indicators of health and scalability. Entrepreneurs and managers use them to measure efficiency and set prices that ensure long-term viability.
Gross vs. Net Profit Margin
A business may generate millions in revenue, but the only number that truly matters for sustainability is the profit margin.
-
Gross Profit Margin is calculated by taking Gross Profit (Revenue minus Cost of Goods Sold) and dividing it by Revenue.
-
Net Profit Margin is calculated by taking Net Income (all revenue minus all expenses) and dividing it by Revenue.
If a company has $1,000,000 in sales and $200,000 in net profit, its net profit margin is 20%. This percentage allows the business owner to understand how much of every dollar earned actually stays in the company’s pocket. It also facilitates benchmarking against industry standards to see if the business is operating efficiently compared to competitors.
Calculating Year-over-Year (YoY) Growth
Growth is almost always expressed as a percentage. To find the YoY growth of a business’s revenue, you compare the revenue from the current year to the revenue from the previous year using the percentage change formula:
[(Current Year – Previous Year) / Previous Year] × 100
This percentage gives stakeholders a clear picture of the company’s trajectory. A 10% growth rate suggests a steady, healthy expansion, while a 50% growth rate might signal a breakout success or an unsustainable “burn” of resources.
Advanced Tools and Techniques for Financial Accuracy
While the manual calculation is essential for conceptual understanding, modern finance relies on digital tools to handle these percentages at scale and with zero margin for error.
Using Excel and Google Sheets for Automation
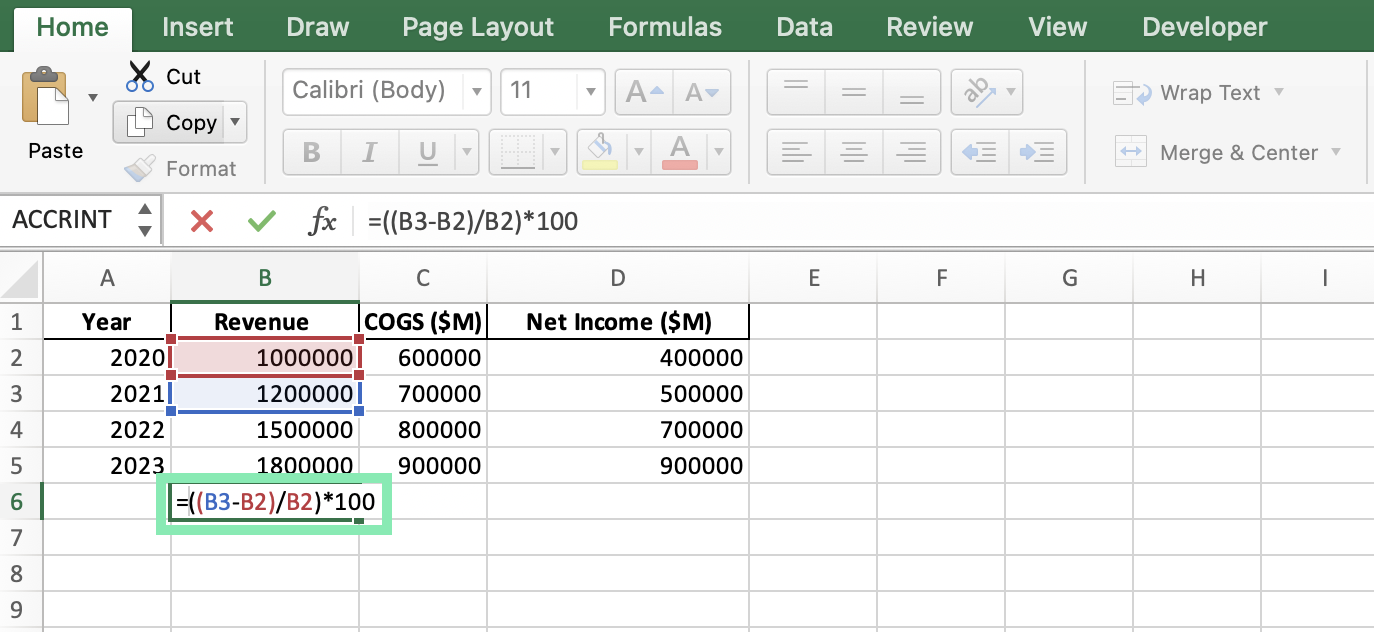
Spreadsheets are the backbone of financial analysis. In software like Microsoft Excel or Google Sheets, you don’t need to manually multiply by 100. If you have the “part” in cell A1 and the “whole” in cell B1, you simply enter the formula =A1/B1. By selecting the “Percentage” format from the toolbar, the software automatically converts the decimal and adds the “%” symbol.
This automation is particularly useful for sensitivity analysis. For instance, you can create a model to see how your monthly mortgage payment (as a percentage of income) changes if interest rates rise by 0.5% or 1%.
Financial Calculators and Professional Software
For more complex scenarios, such as determining the internal rate of return (IRR) or the annual percentage rate (APR) on a loan with compounding interest, basic percentage formulas are integrated into sophisticated algorithms. However, even when using these tools, a foundational knowledge of how the two numbers relate ensures that you can spot “garbage in, garbage out” scenarios. If the software produces a percentage that feels intuitively wrong based on your mental math, it prompts a deeper audit of the data entries.
In conclusion, knowing how to get the percentage of two numbers is more than just a math trick; it is a vital component of financial literacy. It allows you to strip away the noise of large, confusing currency figures and see the underlying truth of your financial situation. Whether you are saving for a home, investing in the markets, or running a multinational corporation, the humble percentage remains your most reliable tool for measurement and growth.
aViewFromTheCave is a participant in the Amazon Services LLC Associates Program, an affiliate advertising program designed to provide a means for sites to earn advertising fees by advertising and linking to Amazon.com. Amazon, the Amazon logo, AmazonSupply, and the AmazonSupply logo are trademarks of Amazon.com, Inc. or its affiliates. As an Amazon Associate we earn affiliate commissions from qualifying purchases.