
In a world increasingly driven by data and financial literacy, the ability to calculate and understand percentages is not merely a mathematical curiosity; it is a critical life skill. From managing personal budgets to making shrewd investment decisions, percentages are the silent language of money. They quantify change, compare values, and reveal the true impact of financial events. For anyone navigating the complexities of personal finance, investing, or business, mastering the art of percentages is non-negotiable. This article will demystify percentages, providing clear methodologies and illustrating their indispensable role across the financial landscape.

The Basics: Understanding What a Percentage Truly Means
Before diving into the mechanics of calculation, it’s crucial to grasp the fundamental concept of a percentage. This foundational understanding will illuminate why this simple mathematical tool is so powerful in financial contexts.
Defining the Core Concept: Part of a Whole
At its heart, a percentage represents a proportion or a fraction of a whole, expressed as a number out of 100. The word “percent” itself is derived from the Latin “per centum,” meaning “by the hundred.” When you say “25 percent,” you are essentially stating “25 out of 100,” or 25/100, which simplifies to 1/4. It’s a standardized way to compare parts of different wholes, making complex data digestible and relatable.
Unlike raw numbers or fractions, percentages offer a universal scale. Whether you’re comparing a small discount on a coffee or the national debt as a proportion of GDP, the percentage format provides a common basis for understanding relative size and impact. This standardization is what makes percentages so invaluable in financial communication and analysis.
The Ubiquity of Percentages in Finance
From the moment you earn your first paycheck to planning for retirement, percentages are interwoven into nearly every financial interaction. Consider the interest rate on a savings account or a loan, the discount applied during a sale, the tax rate on your income, or the return on your investment. All these critical figures are expressed as percentages.
In personal finance, percentages help you visualize how much of your income goes towards housing, how much debt you carry relative to your assets, or the pace at which your savings are growing. For investors, they quantify returns, measure risk, and track market movements. In business finance, profit margins, growth rates, and market share are almost universally communicated through percentages. Without a firm grasp of how to calculate and interpret them, making informed financial decisions becomes significantly more challenging, if not impossible.
Essential Formulas and Step-by-Step Calculations
Understanding the theory is one thing; applying it is another. Fortunately, calculating percentages involves a few straightforward formulas that, once mastered, open up a world of financial insights.
Calculating a Percentage of a Number: Finding the Value
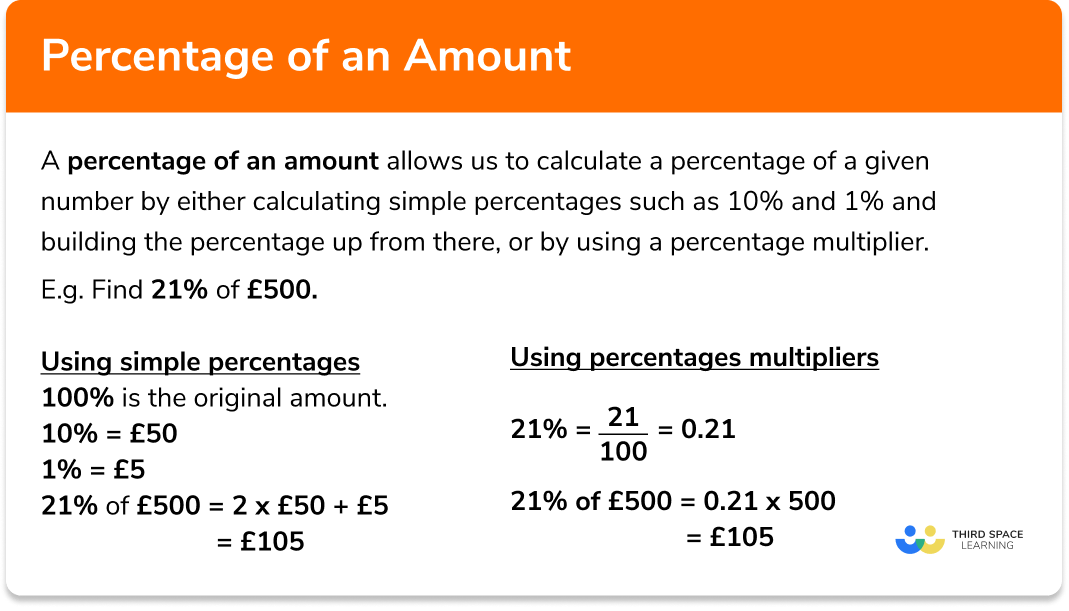
This is perhaps the most common percentage calculation. You often need to find out what a certain percentage of a given number is. For example, “What is 20% of $500?”
Formula: Percentage (as a decimal) × Whole Number
Steps:
-
Convert the percentage to a decimal: Divide the percentage by 100. (e.g., 20% ÷ 100 = 0.20)
-
Multiply the decimal by the whole number: (e.g., 0.20 × $500 = $100)
So, 20% of $500 is $100. This calculation is vital for determining sales tax, discounts, interest earnings, or even the portion of your income you allocate to a specific budget category. If you want to put 15% of your $4,000 monthly income into savings, you’d calculate 0.15 × $4,000 = $600.
Finding What Percentage One Number Is of Another: Comparing Proportions
Often, you have two numbers and want to express the smaller one as a percentage of the larger one. For instance, “What percentage is $75 of $300?”
Formula: (Part ÷ Whole) × 100
Steps:
-
Divide the part by the whole: (e.g., $75 ÷ $300 = 0.25)
-
Multiply the result by 100 to convert to a percentage: (e.g., 0.25 × 100 = 25%)
So, $75 is 25% of $300. This is incredibly useful for calculating your expense ratios (e.g., what percentage of your total spending is on dining out?), profit margins, or the return on a specific investment relative to its initial cost. If your investment grew from $10,000 to $12,000, your gain is $2,000. To find the percentage return: ($2,000 ÷ $10,000) × 100 = 20%.
Percentage Increase and Decrease: Growth and Loss
Understanding how quantities change over time is crucial for financial analysis. Whether it’s the growth of an investment, the inflation rate, or a change in your salary, percentage change provides context.
Formula for Percentage Increase: ((New Value - Original Value) ÷ Original Value) × 100
Formula for Percentage Decrease: ((Original Value - New Value) ÷ Original Value) × 100
Example (Increase): Your stock portfolio grew from $10,000 to $12,000.
((12,000 - 10,000) ÷ 10,000) × 100 = (2,000 ÷ 10,000) × 100 = 0.20 × 100 = 20% increase.
Example (Decrease): A stock dropped from $50 to $40.
((50 - 40) ÷ 50) × 100 = (10 ÷ 50) × 100 = 0.20 × 100 = 20% decrease.
These calculations are fundamental for tracking investment performance, analyzing market trends, evaluating business growth, and understanding the real impact of economic indicators like inflation.
Working Backwards: Finding the Original Number
Sometimes you know the percentage and the resulting part, but you need to find the original whole. For example, “After a 20% discount, an item costs $80. What was its original price?”
Steps:
-
Understand the relationship: If there’s a 20% discount, the $80 represents 100% – 20% = 80% of the original price.
-
Convert the known percentage to a decimal: 80% ÷ 100 = 0.80
-
Divide the known part by the decimal percentage: $80 ÷ 0.80 = $100
The original price was $100. This “working backward” skill is invaluable for understanding pre-tax prices, original investment values before growth, or calculating gross income before deductions.
Practical Applications in Personal Finance
Mastering percentage calculations moves from academic exercise to powerful tool when applied to personal finance. It transforms abstract numbers into actionable insights.
Budgeting and Expense Management
Percentages are the bedrock of effective budgeting. They allow you to allocate your income intelligently and monitor spending habits critically. Instead of thinking “I spend $500 on groceries,” you can think “I spend 12.5% of my income on groceries.” This provides a clearer picture of proportions and allows for easier comparison with recommended guidelines (e.g., the 50/30/20 rule for needs/wants/savings).
-
Calculating Spending Ratios: (Category Expense ÷ Total Income) × 100
-
Tracking Budget Adherence: If you budget 10% for entertainment and spend 12%, you immediately see you’re over budget.
Understanding Loan Interest Rates and Savings Yields
Few financial areas are more percentage-dependent than loans and savings.
-
Loan Interest: A 5% annual interest rate on a $10,000 loan means you’ll pay $500 in interest the first year (0.05 × $10,000), assuming simple interest. Understanding how interest compounds (interest on interest) requires a deeper dive but is still rooted in percentage calculations.
-
Savings Yields: A savings account offering a 1.5% Annual Percentage Yield (APY) means your initial deposit will grow by 1.5% over a year. Calculating the future value of your savings or investments relies heavily on compounding percentages.
Sales Tax, Discounts, and Tips: Everyday Calculations
These are the most frequent percentage calculations people encounter daily.
-
Sales Tax: If an item is $20 and the sales tax is 8%, the tax amount is $20 × 0.08 = $1.60.
-
Discounts: A $50 item with a 25% discount means you save $50 × 0.25 = $12.50. The new price is $50 – $12.50 = $37.50.
-
Tips: Tipping 18% on a $35 meal means an additional $35 × 0.18 = $6.30.
Accurate and quick calculation of these percentages ensures you pay the correct amount, verify charges, and avoid overspending.
Retirement Planning and Investment Growth
Long-term financial goals, especially retirement, are heavily reliant on the power of compounding percentages.
-
Compound Annual Growth Rate (CAGR): This metric expresses the average annual growth rate of an investment over a specified period longer than one year, factoring in the effect of compounding. It helps compare the performance of different investments.
-
Inflation’s Impact: A 3% annual inflation rate means your purchasing power decreases by 3% each year. Understanding this percentage helps you determine how much your investments really need to grow to maintain or increase your wealth.
-
Contribution Percentages: Deciding to contribute 10% or 15% of your salary to a retirement account makes a significant difference over decades, directly impacting your financial security in later life.
Percentages in Business and Investing
Moving beyond personal finance, percentages are the language of business analytics and investment strategy. They provide a standardized framework for evaluating performance, risk, and opportunity.
Profit Margins and Revenue Growth
Businesses use percentages to measure their operational efficiency and success.
-
Gross Profit Margin:
((Revenue - Cost of Goods Sold) ÷ Revenue) × 100. This tells a company how much profit it makes from each sale after accounting for direct costs. -
Net Profit Margin:
((Net Income) ÷ Revenue) × 100. This shows the percentage of revenue left after all expenses, including taxes, have been deducted. -
Revenue Growth:
((Current Period Revenue - Previous Period Revenue) ÷ Previous Period Revenue) × 100. This indicates how quickly a company is expanding its sales. Investors closely watch these percentages to gauge a company’s health and potential for future returns.
Return on Investment (ROI) and Capital Gains
For investors, ROI is a foundational metric for assessing the profitability of an investment.
-
ROI:
((Net Profit from Investment - Cost of Investment) ÷ Cost of Investment) × 100. A 15% ROI means for every dollar invested, you gained 15 cents in profit. -
Capital Gains: When you sell an asset for more than you paid for it, the increase in value is often expressed as a percentage gain. Understanding these percentages is crucial for evaluating past investment performance and making future decisions.
Analyzing Financial Ratios and Performance
Financial analysts and savvy investors rely on a suite of percentage-based ratios to dissect a company’s financial statements.
-
Debt-to-Equity Ratio: Expressed as a percentage, this indicates the proportion of debt a company uses to finance its assets relative to the value of shareholders’ equity. A high percentage can signal higher risk.
-
Current Ratio: While often expressed as a decimal, it can be viewed as a percentage, indicating a company’s ability to meet short-term obligations.
-
Dividend Yield:
(Annual Dividends per Share ÷ Share Price) × 100. This tells investors the percentage return they receive in dividends relative to the stock’s price.
These ratios provide a standardized way to compare companies within an industry or track a single company’s performance over time.
Inflation and Its Impact on Purchasing Power
Inflation, expressed as a percentage, is a critical economic indicator. If the inflation rate is 3%, it means that the cost of goods and services is, on average, 3% higher than it was a year ago.
-
Real vs. Nominal Returns: Understanding the inflation rate allows investors to calculate their “real” return on investment (the return after accounting for inflation). If your investment grew by 7% but inflation was 3%, your real return was only approximately 4%.
-
Erosion of Savings: A high inflation rate can rapidly erode the purchasing power of cash sitting in low-yield savings accounts, making it imperative to invest in assets that can outpace inflation.
Leveraging Tools and Avoiding Common Pitfalls
While manual calculation is fundamental, modern tools can simplify the process, but it’s essential to use them wisely and avoid common misinterpretations.
Digital Calculators and Spreadsheet Functions
For speed and accuracy, digital tools are indispensable.
-
Basic Calculators: Most scientific and even smartphone calculators have a “%” button that simplifies percentage calculations.
-
Spreadsheet Software (Excel, Google Sheets): These are powerful tools for managing financial data and performing complex percentage calculations. Functions like
=(A2/B2)*100for finding a percentage or=(A2*0.05)for finding 5% of a number make financial modeling efficient. They are especially useful for budgeting, tracking investments, and analyzing business performance over time.
The Importance of Context and Base Numbers
A percentage is only as meaningful as the context and the “whole” number it’s derived from.
-
Small Base, Big Percentage: A 100% increase on $10 is only $10, while a 10% increase on $1,000,000 is $100,000. Always look at the absolute numbers behind the percentages.
-
Misleading Comparisons: Comparing percentages without considering the base can be deceptive. A “20% market share” in a niche industry might be less significant than a “5% market share” in a massive global market.

Avoiding Misinterpretations and “Percentage Point” Confusion
A common mistake is confusing percentage change with “percentage point” change.
-
Percentage Change: Refers to the proportional change in a quantity. (e.g., if a stock goes from $100 to $110, that’s a 10% increase.)
-
Percentage Point Change: Refers to the absolute change between two percentages. (e.g., if an interest rate increases from 4% to 5%, that’s a 1 percentage point increase, not a 25% increase (which would be (5-4)/4 * 100 = 25%).) This distinction is critical in financial news and analysis, particularly when discussing interest rates, unemployment rates, or market share changes. Misinterpreting this can lead to flawed conclusions about financial trends.
In conclusion, understanding “how you can get the percentage of a number” is more than a simple mathematical skill; it’s a foundational element of financial literacy. From daily spending decisions to long-term investment strategies and comprehensive business analysis, percentages provide the necessary clarity and context to make informed and intelligent choices. By mastering these core calculations and applying them judiciously, individuals and businesses alike can unlock deeper insights, manage risk more effectively, and ultimately achieve greater financial success.
aViewFromTheCave is a participant in the Amazon Services LLC Associates Program, an affiliate advertising program designed to provide a means for sites to earn advertising fees by advertising and linking to Amazon.com. Amazon, the Amazon logo, AmazonSupply, and the AmazonSupply logo are trademarks of Amazon.com, Inc. or its affiliates. As an Amazon Associate we earn affiliate commissions from qualifying purchases.