
Graphing a line from an equation is a foundational skill in mathematics, yet its utility extends far beyond the classroom, permeating various facets of the technology landscape. From data science and engineering to software development and user interface design, the ability to visualize linear relationships provides critical insights and underpins countless digital applications. This comprehensive tutorial will guide you through the essential steps, covering both traditional manual methods and the powerful digital tools that streamline and enhance the graphing process, firmly embedding this skill within the technological realm.
The Fundamentals: Understanding the Coordinate Plane and Linear Equations
Before diving into the mechanics of plotting, a solid grasp of the underlying concepts is crucial. Every line we graph exists within a spatial framework, defined by a specific mathematical relationship.

The Cartesian Coordinate System
The bedrock of graphing is the Cartesian coordinate system, also known as the rectangular coordinate system. This two-dimensional plane is formed by two perpendicular number lines:
-
The x-axis: The horizontal line, representing independent variables or inputs.
-
The y-axis: The vertical line, representing dependent variables or outputs.
The point where these two axes intersect is called the origin, denoted as (0, 0). Points on this plane are identified by an ordered pair (x, y), indicating their horizontal and vertical distance from the origin. The plane is divided into four quadrants, numbered counter-clockwise from the top-right. Understanding this grid is the first step to accurately placing points and drawing lines.
Anatomy of a Linear Equation
A linear equation is any equation that, when graphed, forms a straight line. The defining characteristic is that the highest power of any variable is one. There are several forms, but two are particularly useful for graphing:
-
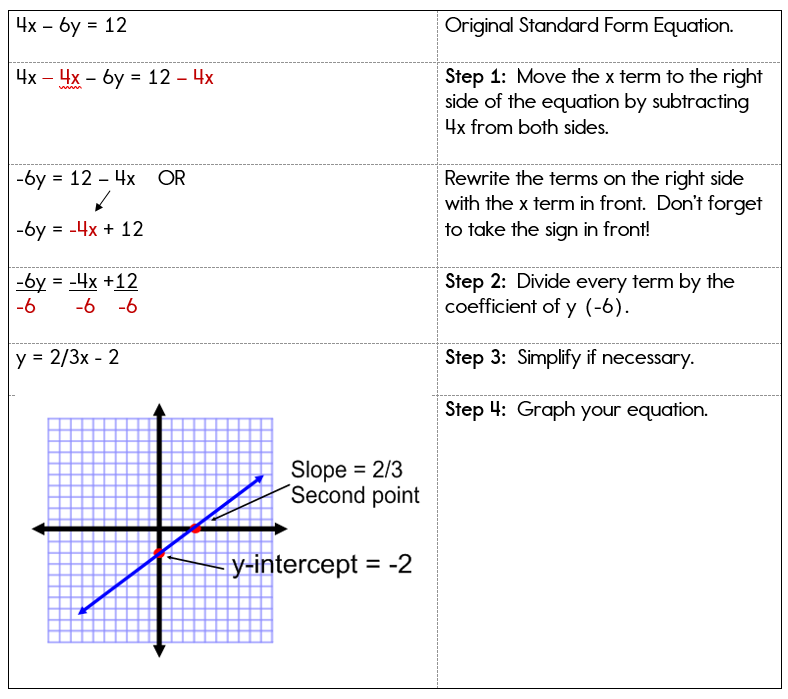
Standard Form: $Ax + By = C$
Here, A, B, and C are constants, and x and y are the variables. While useful for certain algebraic manipulations, it’s not always the most intuitive for direct graphing. For instance, $3x + 2y = 6$.
-
Slope-Intercept Form: $y = mx + b$
This is arguably the most powerful and intuitive form for graphing.
-
m represents the slope of the line. Slope is a measure of the line’s steepness and direction, calculated as “rise over run” ($frac{text{change in y}}{text{change in x}}$). A positive slope indicates the line rises from left to right, a negative slope means it falls.
-
b represents the y-intercept. This is the point where the line crosses the y-axis. At this point, the x-coordinate is always 0, so the y-intercept is expressed as the coordinate (0, b).
-
Another form, the point-slope form ($y – y1 = m(x – x1)$), is useful when you know the slope and one point on the line, but it can easily be converted into slope-intercept form for graphing.
Manual Graphing Techniques: Building Foundational Skills
Even with advanced digital tools, understanding the manual process of graphing builds a fundamental intuition for linear relationships and their visual representation. This foundational knowledge is invaluable for debugging, estimating, and comprehending the output of technological solutions.
Method 1: Using the Slope-Intercept Form ($y = mx + b$)
This is often the quickest and most straightforward manual method when your equation is already in or can be easily converted to slope-intercept form.
Steps:
-
Identify the y-intercept (b): This is the point where your line will cross the y-axis. Plot this point on your coordinate plane. Remember, its coordinates will be (0, b).
- Example: For $y = frac{2}{3}x – 1$, the y-intercept is -1. So, plot the point (0, -1).
-
Identify the slope (m): Express the slope as a fraction, $frac{text{rise}}{text{run}}$. If it’s a whole number, put it over 1 (e.g., $m = 2$ becomes $frac{2}{1}$).
- Example: For $y = frac{2}{3}x – 1$, the slope is $frac{2}{3}$. This means for every 3 units you move horizontally to the right (run), you move 2 units vertically up (rise).
-
Use the slope to find a second point: Starting from your y-intercept, use the “rise over run” instruction from your slope.
-
If rise is positive, move up; if negative, move down.
-
If run is positive, move right; if negative, move left.
-
Example: From (0, -1), move up 2 units and right 3 units. You will land at the point (3, 1). This is your second point.
-
-
Draw the line: Connect the two points with a straight edge, extending the line in both directions and adding arrows to indicate it continues infinitely.
Method 2: Plotting Points from a Table of Values
This method is more general and can be used for any linear equation, especially when it’s not easily converted to slope-intercept form or when you want to confirm your other methods.
Steps:
-
Choose several x-values: Select a few simple values for x, including zero, some positive numbers, and some negative numbers. Typically, 3-5 points are sufficient to ensure accuracy.
- Example: For $2x – y = 4$, let’s choose x = -1, 0, 1, 2.
-
Substitute x-values into the equation to find y-values: For each chosen x-value, solve the equation for y to find the corresponding y-coordinate.
-
Example:
-
If $x = -1$: $2(-1) – y = 4 implies -2 – y = 4 implies -y = 6 implies y = -6$. Point: (-1, -6)
-
If $x = 0$: $2(0) – y = 4 implies -y = 4 implies y = -4$. Point: (0, -4)
-
If $x = 1$: $2(1) – y = 4 implies 2 – y = 4 implies -y = 2 implies y = -2$. Point: (1, -2)
-
If $x = 2$: $2(2) – y = 4 implies 4 – y = 4 implies -y = 0 implies y = 0$. Point: (2, 0)
-
-
-
Create (x, y) coordinate pairs: Organize these pairs, perhaps in a simple table.
| x | y | (x, y) |
|—|—|——–|
|-1 |-6 |(-1, -6)|
| 0 |-4 |(0, -4) |
| 1 |-2 |(1, -2) |
| 2 | 0 |(2, 0) |
-
Plot the points: Locate each coordinate pair on your Cartesian plane and mark it.
-
Draw the line: Once all points are plotted, connect them with a straight edge. If they don’t form a perfectly straight line, recheck your calculations, as it indicates an error. Extend the line in both directions with arrows.
Leveraging Technology for Efficient and Accurate Graphing
While manual graphing is crucial for building understanding, the power of modern technology makes the process faster, more accurate, and enables complex visualizations impossible by hand. In the tech world, digital tools are the standard for graphing and data visualization.
Online Graphing Calculators and Web Apps
Platforms like Desmos and GeoGebra have revolutionized access to graphing capabilities. They are intuitive, free, and incredibly powerful.
-
How they work: You simply type in your equation (e.g.,
y = 2/3x - 1or2x - y = 4), and the graph instantly appears. You can easily modify parameters, add multiple equations, find intersection points, and explore the visual impact of changes in slope or intercept. -
Benefits: Speed, precision, interactivity, and the ability to visualize multiple functions simultaneously. They are excellent educational tools for exploring concepts and ideal for quick checks in professional settings. Their accessibility via any web browser makes them indispensable.
Desktop Software for Advanced Visualization
For more robust analysis, larger datasets, or integration into complex workflows, desktop software offers greater depth.
-
Microsoft Excel: While not a dedicated graphing calculator, Excel is a powerful tool for creating visual representations of data. You can input x-values and use formulas to calculate corresponding y-values, creating a table of points. Then, using the “Scatter Plot” chart type, you can plot these points and add a “Trendline” (linear in this case) to visualize the line and even display its equation. This is particularly useful when working with empirical data that approximates a linear relationship.
-
MATLAB and Python with Matplotlib: For engineers, scientists, and data analysts, programmatic graphing is essential.
-
MATLAB is a proprietary numerical computing environment that includes robust plotting functions. Users can define x and y arrays and use commands like
plot(x, y)to generate graphs, along with extensive customization options. -
Python, with its
matplotliblibrary, is an open-source alternative favored in data science and machine learning. You define your range for x-values (e.g., usingnumpy.linspace), calculate y-values based on your equation, and then useplt.plot(x, y)to render the line. Python’s power lies in its ability to integrate graphing with complex data processing, statistical analysis, and machine learning model visualization.
-
-
Benefits: These tools offer unparalleled control, customization, automation capabilities for repetitive tasks, and the ability to handle massive datasets. They are integral to scientific research, engineering design, and data-driven decision-making.
Graphing on Dedicated Calculators
Traditional graphing calculators, such as those from Texas Instruments (TI-84 series) or Casio, remain staples in academic environments.
-
How they work: Users input equations into a “Y=” editor, define a viewing window, and press “GRAPH.” These calculators can also generate tables of values, find intercepts, and calculate intersection points.
-
Benefits: Portability, reliability in exam settings, and a consistent interface. While less visually sophisticated than web apps, they provide essential graphing functionality without internet access.
Why Graphing Matters in the Digital Age: Applications in Tech
The seemingly simple act of graphing a line from an equation is a fundamental building block for numerous advanced applications in technology.
Data Visualization and Analytics
In the age of big data, linear graphs are crucial for presenting relationships and trends clearly. They help analysts visualize correlations, predict future outcomes through regression analysis, and identify patterns in everything from stock prices to website traffic. Understanding the slope and intercept of a graphed line can reveal growth rates, baseline values, and other vital metrics.
Software Development and Game Design
Linear equations are ubiquitous in programming.
-
Game Development: They define trajectories for projectiles, movement paths for characters, simple physics simulations (e.g., constant velocity), and camera controls.
-
UI/UX Design: Grids, responsive layouts, and the scaling of elements often rely on linear relationships. Developers use them to calculate object positions and dimensions based on screen size or user input.
-
General Programming: Linear equations are used for interpolation, basic animation curves, and algorithms that require predictable, steady changes.
Engineering and Scientific Computing
From electrical circuits to structural mechanics, engineers rely on linear models to represent system behavior.
-
Signal Processing: Analyzing linear filters and system responses.
-
Control Systems: Designing controllers where output is a linear function of input.
-
Thermodynamics: Modeling gas laws and heat transfer where relationships are often linear or approximated as such over certain ranges.
Graphing these relationships allows for quick validation of models and prediction of system performance.
AI and Machine Learning
Linear regression, one of the simplest yet most powerful machine learning algorithms, hinges entirely on finding the “best-fit” line through a set of data points. Understanding how to graph a line is foundational to grasping concepts like:
-
Cost Functions: Visualizing the error surface, often parabolic for linear models.
-
Gradient Descent: Imagining how the algorithm “walks” down the slope of the error surface.
-
Decision Boundaries: For simple classification problems, a linear boundary separates different classes of data.
User Interface/User Experience (UI/UX) Design
While perhaps less direct, the principles of linear alignment, spacing, and proportion are critical in creating aesthetically pleasing and functional interfaces. Grids, guides, and responsive design systems often implicitly leverage linear scaling and positioning rules. Data dashboards frequently use line graphs to represent trends over time, making complex information accessible at a glance.

Conclusion
Graphing a line from an equation is far more than a mere mathematical exercise; it’s a fundamental skill that bridges abstract mathematics with tangible visualization and practical application across the technological spectrum. Whether you choose to meticulously plot points by hand to solidify your understanding or leverage the instantaneous precision of online calculators and sophisticated programming libraries, the ability to translate an algebraic expression into a visual representation is invaluable.
Embrace both the manual techniques for building core intuition and the powerful digital tools that amplify your capabilities. As technology continues to advance, the demand for individuals who can not only understand but also effectively communicate data and relationships visually will only grow. Master this skill, and you’ll unlock a deeper understanding of the world around you, both on and off the screen.
aViewFromTheCave is a participant in the Amazon Services LLC Associates Program, an affiliate advertising program designed to provide a means for sites to earn advertising fees by advertising and linking to Amazon.com. Amazon, the Amazon logo, AmazonSupply, and the AmazonSupply logo are trademarks of Amazon.com, Inc. or its affiliates. As an Amazon Associate we earn affiliate commissions from qualifying purchases.