
In the high-stakes world of global finance, few phrases are uttered with as much frequency or gravity as “what’s the Dow trading at?” For the seasoned investor, the Dow Jones Industrial Average (DJIA) is more than just a number on a screen; it is a barometer of economic health, a reflection of corporate sentiment, and a historical record of the American industrial spirit. Established in 1896, the Dow remains one of the most-watched indices in the world, despite the emergence of more technologically weighted or broader market benchmarks. Understanding where the Dow is trading requires more than a glance at a ticker; it necessitates a deep dive into the mechanics of the index, the macroeconomic factors driving its movement, and the psychological thresholds that govern investor behavior.
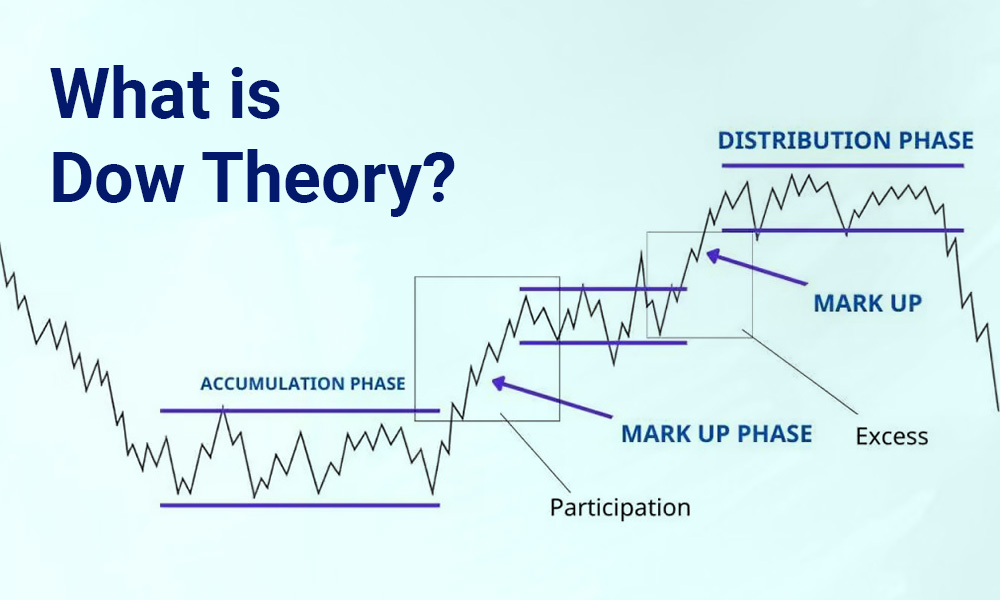
The Anatomy of the Dow Jones Industrial Average
To understand why the Dow trades at its current level, one must first grasp its unique architecture. Unlike the S&P 500 or the Nasdaq Composite, which are market-capitalization-weighted indices, the Dow is a price-weighted index. This means that companies with higher share prices exert a greater influence on the index’s movement than those with lower share prices, regardless of the company’s actual market size or total valuation.
The Price-Weighting Mechanism
The price-weighted nature of the Dow is a vestige of the late 19th century, a time before computers could easily calculate complex weighted averages. Today, this structure creates a fascinating dynamic. For example, if a high-priced stock like UnitedHealth Group or Goldman Sachs experiences a 5% swing, it will move the Dow significantly more than a 5% swing in a lower-priced stock like Verizon or Coca-Cola. Critics often argue that this method is antiquated, yet it remains remarkably resilient as a proxy for the broader “Blue Chip” economy. The 30 companies that comprise the Dow are selected by a committee to represent the primary sectors of the U.S. economy, excluding transportation and utilities, which have their own dedicated indices.
The Dow Divisor: A Constant in Motion
One of the most misunderstood components of the Dow’s price is the “Dow Divisor.” Many novice investors assume that you simply add the prices of the 30 stocks and divide by 30 to get the index value. However, due to stock splits, spin-offs, and periodic changes in the index composition, a simple arithmetic mean would lead to massive distortions. To maintain continuity, the “Dow Divisor” is used. This is a numerical constant that is adjusted whenever a structural change occurs in the constituent stocks. As of recent years, the divisor is significantly less than one, meaning that a $1 change in the price of any single stock in the index results in a much larger move in the total point value of the Dow.
Key Drivers Behind the Dow’s Daily Movement
When an investor asks what the Dow is trading at, they are looking for a snapshot of current market sentiment. This sentiment is rarely driven by a single factor. Instead, it is the result of a complex interplay between central bank policy, inflationary trends, and the fundamental performance of the 30 constituent giants.
Macroeconomic Indicators and the Federal Reserve
The single most influential force on the Dow’s trading level in the current era is the Federal Reserve. The “Fed’s” decisions regarding the federal funds rate act as a gravity-like force on stock valuations. When interest rates are low, borrowing costs for the Dow’s industrial and financial giants are reduced, stimulating growth and making equity returns more attractive than fixed-income yields. Conversely, when the Fed adopts a “hawkish” stance to combat inflation, the Dow often faces downward pressure.
Investors closely monitor the Consumer Price Index (CPI) and Personal Consumption Expenditures (PCE) reports. If inflation appears to be cooling, the Dow often rallies on the hope of a “dovish” pivot by the Fed. If inflation remains “sticky,” the Dow may retreat as investors price in the likelihood of “higher for longer” interest rates. This macro-environment dictates whether the Dow breaks through resistance levels or falls toward historical support.
Corporate Earnings and the Wealth Effect
As an index composed of 30 of the most established companies in the world—names like Apple, Microsoft, Boeing, and JPMorgan Chase—the Dow is highly sensitive to the quarterly earnings cycle. During “Earnings Season,” the Dow’s trading level becomes a direct reflection of corporate profitability and future guidance. If the majority of the 30 components report earnings that beat analyst expectations, the Dow typically sees a sustained upward trajectory.

Furthermore, the Dow is a significant driver of the “Wealth Effect.” Because the Dow is so widely reported in mainstream media, its performance has a psychological impact on consumer spending. When the Dow is trading at all-time highs, retail investors and consumers feel wealthier, leading to increased spending which, in turn, bolsters the very companies that make up the index. This creates a feedback loop that can sustain bull markets for years.
The Dow vs. The Wider Market: Navigating Volatility
It is common to see the Dow trading “flat” while the Nasdaq is up significantly, or vice versa. This divergence is crucial for investors to understand, as it highlights the rotation of capital between different sectors of the economy.
Why the S&P 500 and Nasdaq Differ
The Dow is often referred to as the “Value” index, while the Nasdaq is seen as the “Growth” index. Because the Dow includes massive, dividend-paying companies with stable cash flows, it often outperforms during periods of economic uncertainty or rising interest rates. In contrast, the tech-heavy Nasdaq thrives when liquidity is high and investors are willing to pay a premium for future growth.
The S&P 500 serves as a middle ground, covering 500 of the largest U.S. companies. When you observe where the Dow is trading relative to these other indices, you can identify “sector rotation.” If the Dow is leading the market higher, it suggests that investors are moving into “defensive” or “cyclical” stocks—those that produce tangible goods and services. If the Dow is lagging, it may indicate a “risk-on” environment where investors prefer high-growth technology plays.
Interpreting Market Sentiment Through the Dow
The Dow is also a primary tool for technical analysts who look for patterns in the “what’s it trading at” data. Key psychological milestones, such as Dow 30,000 or Dow 40,000, act as significant hurdles. When the index approaches these round numbers, trading volume often spikes. Breaking through these levels can trigger a wave of institutional buying, while failing to hold them can lead to a “correction”—defined as a 10% drop from recent highs. Understanding these levels allows investors to manage risk and avoid buying at the top of a speculative bubble.
Strategic Considerations for the Modern Investor
For the individual investor, the Dow’s trading level is more than a curiosity; it is a fundamental component of portfolio management. Whether you are an active trader or a long-term retirement saver, the Dow provides the framework for strategic decision-making.
Using the Dow as a Financial Compass
Monitoring where the Dow is trading helps investors determine their asset allocation. During periods where the Dow is trading at high Price-to-Earnings (P/E) ratios relative to historical averages, savvy investors might consider rebalancing their portfolios, taking profits from equities and moving into more stable assets like bonds or high-yield savings accounts.
Additionally, the Dow serves as a benchmark. If your personal investment portfolio is not keeping pace with the Dow’s percentage gains over a year, it may be time to reassess your strategy. Many investors choose to “buy the Dow” directly through Exchange Traded Funds (ETFs) such as the SPDR Dow Jones Industrial Average ETF Trust (DIA), which seeks to provide investment results that, before expenses, correspond generally to the price and yield performance of the DJIA.

Long-term Wealth Accumulation and the DJIA
Despite its daily fluctuations and the noise of the 24-hour news cycle, the historical trajectory of the Dow has been overwhelmingly positive. From its humble beginnings below 100 points to its modern climbs into the tens of thousands, the Dow illustrates the long-term growth of the American and global economy. For those focused on personal finance and side hustles, the lesson of the Dow is one of consistency.
Investing in the companies that make up the Dow is essentially a bet on the continued dominance of established corporate power and innovation. While “what the Dow is trading at” today might cause temporary stress or excitement, the true value of the index lies in its ability to compound wealth over decades. By understanding the mechanics, the drivers, and the historical context of this storied index, investors can move past the headlines and make informed decisions that secure their financial future in an ever-changing economic landscape.
aViewFromTheCave is a participant in the Amazon Services LLC Associates Program, an affiliate advertising program designed to provide a means for sites to earn advertising fees by advertising and linking to Amazon.com. Amazon, the Amazon logo, AmazonSupply, and the AmazonSupply logo are trademarks of Amazon.com, Inc. or its affiliates. As an Amazon Associate we earn affiliate commissions from qualifying purchases.