
In the fast-paced world of global finance, the question “what are the futures doing?” is often the first thought for investors before they even pour their morning coffee. Stock index futures serve as a critical barometer for market sentiment, providing a continuous narrative of how the world’s largest economies are reacting to overnight news, geopolitical shifts, and economic data releases. Unlike the standard trading hours of the New York Stock Exchange or the Nasdaq, the futures market operates nearly 24 hours a day, five days a week. This constant motion allows for a form of price discovery that bridges the gap between the closing bell of one day and the opening bell of the next.
Understanding the movement of futures is not merely about seeing “green” or “red” on a screen; it is about interpreting the underlying forces of supply, demand, and risk appetite. For the individual investor, monitoring these numbers offers a window into the institutional mindset, revealing how the “smart money” is positioning itself before the retail public can execute a single trade at the market open.
The Significance of the Overnight Session
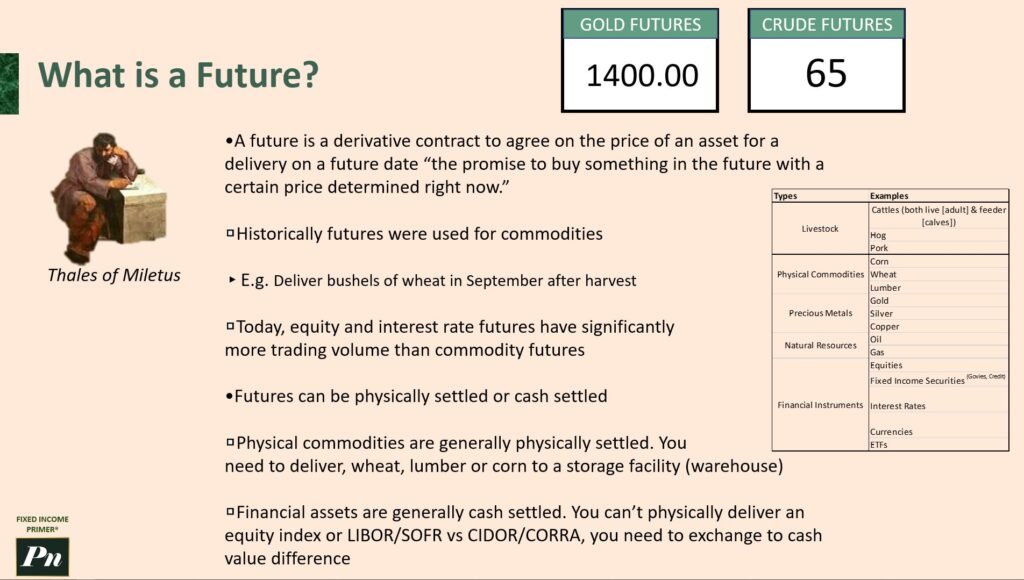
The futures market is essentially a predictive mechanism. When traders ask what the futures are doing, they are typically referring to E-mini S&P 500, Nasdaq-100, or Dow Jones Industrial Average futures. These contracts represent an agreement to buy or sell the value of an index at a predetermined price at a future date. Because they trade through the night, they absorb news that occurs while the U.S. markets are closed.
Price Discovery and Global Liquidity
Price discovery is the process by which the market determines the “fair value” of an asset based on the interaction of buyers and sellers. In the overnight session, this process is influenced heavily by international events. If the European Central Bank makes an unexpected announcement at 3:00 AM EST, or if Asian markets experience a sharp sell-off, U.S. futures will react instantly. This creates a continuous feedback loop.
By the time the 9:30 AM EST opening bell rings in New York, the “opening price” is often a reflection of several hours of intense negotiation in the futures pits. For investors, this means the open is rarely a continuation of the previous day’s close, but rather a “gap” up or down based on the overnight futures movement.
The Correlation Between International Markets
The global financial system is deeply interconnected. Futures provide the connective tissue between the Nikkei in Tokyo, the DAX in Frankfurt, and the S&P 500 in New York. If the Hang Seng index drops significantly due to regulatory concerns in China, U.S. tech futures (the Nasdaq-100) often fall in tandem, as many American tech giants derive substantial revenue from the Asian region. Monitoring futures allows investors to see these ripples turning into waves before they hit the domestic shore.
Navigating the Major Indices: ES, NQ, and Beyond
Not all futures are created equal. Different indices track different sectors of the economy, and their divergence can tell a story about where capital is flowing.
The S&P 500 E-mini (ES): The Gold Standard
The E-mini S&P 500 (symbol: ES) is the most liquid and widely followed futures contract in the world. Because the S&P 500 represents a broad cross-section of the U.S. economy—spanning healthcare, finance, consumer staples, and technology—the ES futures are the primary indicator of overall market health. If the ES is trading up 0.5% in the pre-market, it suggests a broad-based optimism. Institutional investors use the ES not just for speculation, but for hedging massive portfolios. When you see high volume in the ES futures, it often indicates that large funds are adjusting their exposure in response to macro trends.
The Nasdaq-100 (NQ): The Tech Barometer
The Nasdaq-100 futures (symbol: NQ) are the heartbeat of the growth and technology sectors. These contracts are historically more volatile than the S&P 500 because they are heavily weighted toward high-beta companies like Apple, Microsoft, Nvidia, and Tesla. In a “risk-on” environment, the NQ often outperforms the other indices. Conversely, during periods of rising interest rates, the NQ is often the first to feel the pressure, as higher rates discount the future earnings of growth-oriented companies more aggressively.
The Dow and Russell 2000
While the S&P and Nasdaq get the most headlines, the Dow Jones futures (YM) and Russell 2000 futures (RTY) provide essential context. The Dow represents “Blue Chip” industrial and value stocks, while the Russell 2000 tracks small-cap companies. A “rotation” is often visible in the futures market when the NQ is red but the YM or RTY is green. This tells the savvy investor that money is moving out of expensive tech stocks and into undervalued industrials or domestic-focused small businesses.
Macroeconomic Catalysts Moving the Needle

Futures do not move in a vacuum. They are highly sensitive to specific data points that serve as the steering wheel for the broader economy.
Interest Rate Expectations and Treasury Futures
The 10-year Treasury Note futures are perhaps the most influential “non-stock” futures to watch. There is an inverse relationship between bond prices and yields. When Treasury futures fall, yields rise. Because equity valuations are inherently tied to the “risk-free rate” provided by government bonds, a sudden drop in bond futures often triggers an immediate sell-off in stock futures.
Investors watching the “Fed Watch” tool also look at Fed Funds futures. these contracts allow traders to bet on the probability of upcoming interest rate hikes or cuts. If a piece of economic data—like a higher-than-expected Consumer Price Index (CPI) report—hits the tape at 8:30 AM EST, the Fed Funds futures will immediately reprice the likelihood of a rate hike, which in turn causes stock futures to pivot.
Energy and Commodity Interplay
Oil (WTI) and Gold (GC) futures are secondary but vital indicators. Energy futures often move in tandem with geopolitical stability. A spike in oil futures can be a “tax” on the consumer, leading to fears of inflation and slowing economic growth, which can weigh down stock futures. Gold, meanwhile, acts as a “safe haven.” If stock futures are tumbling and gold futures are surging, it indicates a flight to safety, signaling that investors are bracing for a period of high volatility or economic downturn.
Psychological Indicators: Using Futures to Gauge Sentiment
The numbers on the screen are a quantitative representation of a qualitative emotion: the collective psychology of the market. By analyzing how futures behave around key levels, investors can identify the prevailing “mood.”
Identifying Gaps and Reversals
One of the most powerful signals in the market is a “gap.” A gap occurs when the market opens significantly higher or lower than the previous day’s close. Futures tell us where that gap is likely to be. A “gap up” that is sold off immediately in the futures market suggests that the move lacks conviction. However, if futures hold their gains throughout the overnight session despite negative news, it indicates underlying strength and a “buy the dip” mentality among institutional players.
The Role of Institutional Hedging
Institutional investors—such as pension funds and insurance companies—rarely dump their entire stock holdings when they are nervous. Instead, they sell futures contracts against their positions. This “hedging” creates downward pressure on futures prices. When we see a disconnect where the news seems positive but futures are trending lower, it often suggests that institutions are buying protection, anticipating a “sell the news” event.
Practical Considerations for the Modern Investor
While the futures market is an invaluable tool for information, it is also a high-stakes environment for those who choose to trade it directly.
The Risks of High Leverage
Futures are leveraged instruments. This means a small amount of capital can control a very large position. While this allows for significant gains, it also introduces the risk of total capital loss in a very short period. For the retail investor, the best use of “what the futures are doing” is as a diagnostic tool rather than a trading vehicle, unless they have a deep understanding of margin requirements and risk management.

Tools for Tracking Real-Time Data
In the past, real-time futures data was locked behind expensive Bloomberg terminals. Today, platforms like TradingView, Yahoo Finance, and various brokerage apps provide delayed or real-time futures quotes to the general public. Tracking the “Fair Value” vs. the “Current Price” of futures is a specialized skill. Fair value is the theoretical price of a futures contract based on interest rates and dividends. When the futures are trading significantly above fair value, it indicates a positive open for the cash market.
By consistently monitoring what the futures are doing, investors transition from being reactive to being proactive. They start the trading day with a roadmap, understanding the “why” behind the market’s initial direction. Whether it is a reaction to a central bank’s midnight decree or a sudden shift in the price of crude oil, the futures market is the first to know, the first to react, and the ultimate guide for anyone looking to navigate the complexities of modern finance.
aViewFromTheCave is a participant in the Amazon Services LLC Associates Program, an affiliate advertising program designed to provide a means for sites to earn advertising fees by advertising and linking to Amazon.com. Amazon, the Amazon logo, AmazonSupply, and the AmazonSupply logo are trademarks of Amazon.com, Inc. or its affiliates. As an Amazon Associate we earn affiliate commissions from qualifying purchases.